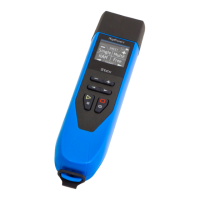
In HAM mode, the SWR icon and the range over which the measurement is carried out are displayed at the
top of the screen.
In the center of the screen, a chart of the SWR values for the range is displayed.
The value of the minimum SWR found and the frequency at which this value was found are displayed at the
bottom of the screen.
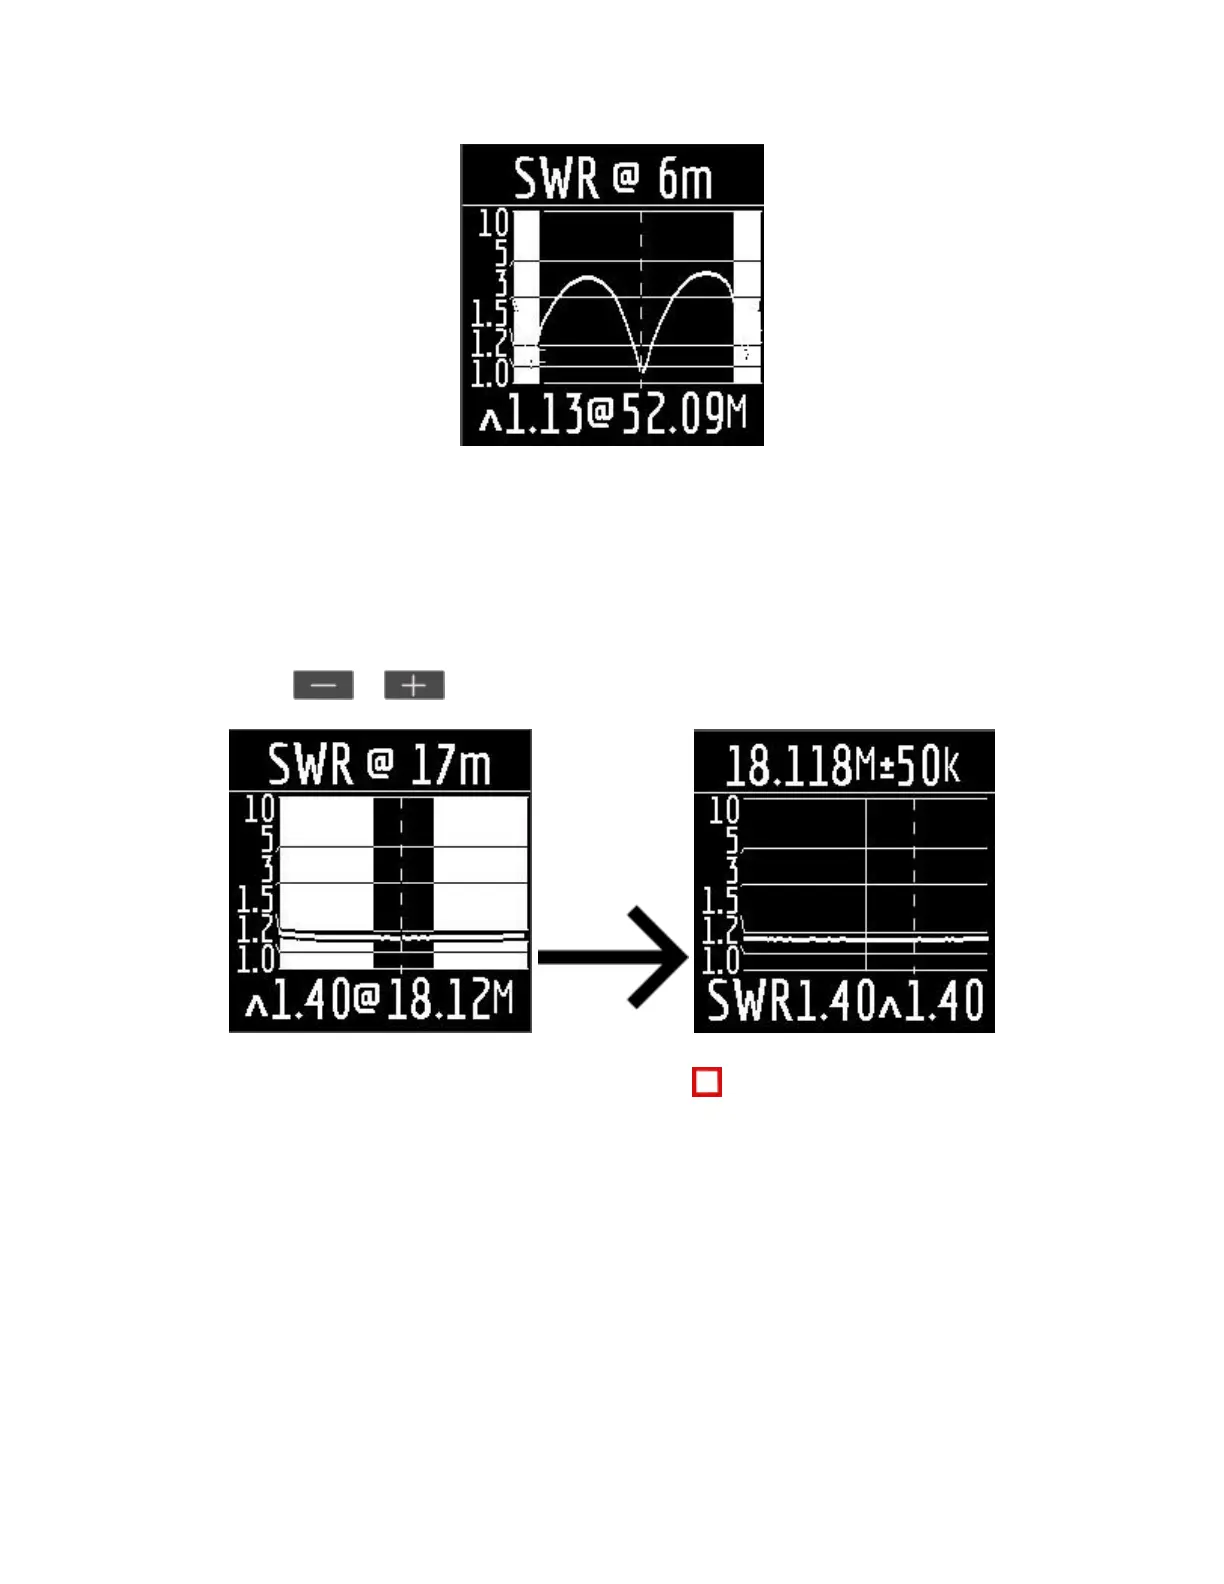
Important! To the left and right of the graph are two vertical stripes. They indicate going out of range. Sometimes the
resonance of the antenna may be out of range, but very close to the beginning or end. In such cases, the analyzer will
determine the resonance beyond the limits of the ranges.
When you press the or keys the analyzer switches to Free mode with the center frequency of
measurement corresponding to the center frequency of the selected range:
You can exit the mode in the main menu by briefly pressing the key.
Free mode.
This is a classic SWR measurement mode with plotting in a user-defined frequency band.
This mode is useful for survey measurement of the antenna in a wide frequency range or for measuring
the SWR in a very narrow predetermined area.
In Free mode, the following is displayed on the analyzer screen:
 Loading...