RIGOL Chapter 3 Functions of the Front Panel of RTSA
3-22 RSA3000 User Guide
relationship. You can use the mouse or touch the screen to display one of the
windows in full screen.
⚫ The parameter rule in the Density view is consistent with that in the single
Density view. Note that the white real-time trace in the Density view
corresponds to the display trace in the Spectrogram view, but the trace in the
Density view shows the latest data.
⚫ The parameter rule in the Spectrogram view is consistent with that displayed in
the single Spectrogram view.
⚫ The combined Density and Spectrogram view display the traces, the occurrences
of all the signals within the acquisition interval time, their corresponding
frequency/amplitude and time information.
PvT
Measurement Interface:
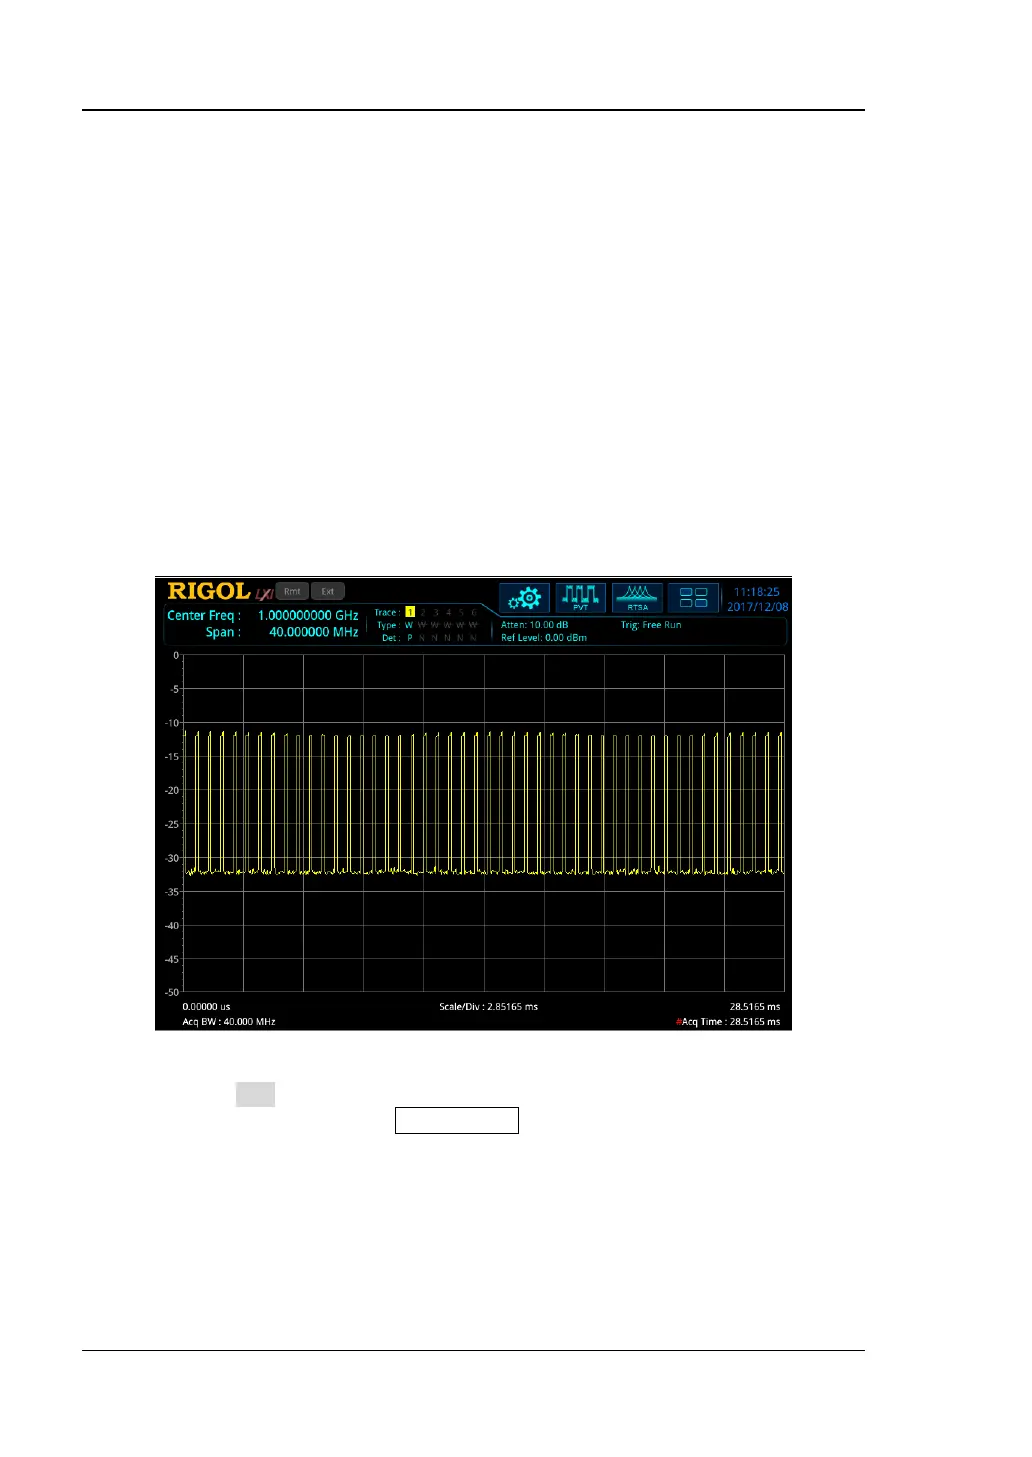
Figure 3-5 PvT View
After you select PvT to be the measurement type, the measurement interface is
shown in the figure above. Press Meas Setup to set the relevant parameters.
Remarks:
⚫ The PvT measurement provides an analysis for time-domain data. X-axis
represents the acquisition time, and Y-axis represents the power value of the
signal.
⚫ In RTSA mode, the acquisition time in PvT measurement can be different from
that in the real-time spectrum measurement, but in the combined display of PvT
 Loading...