8 9
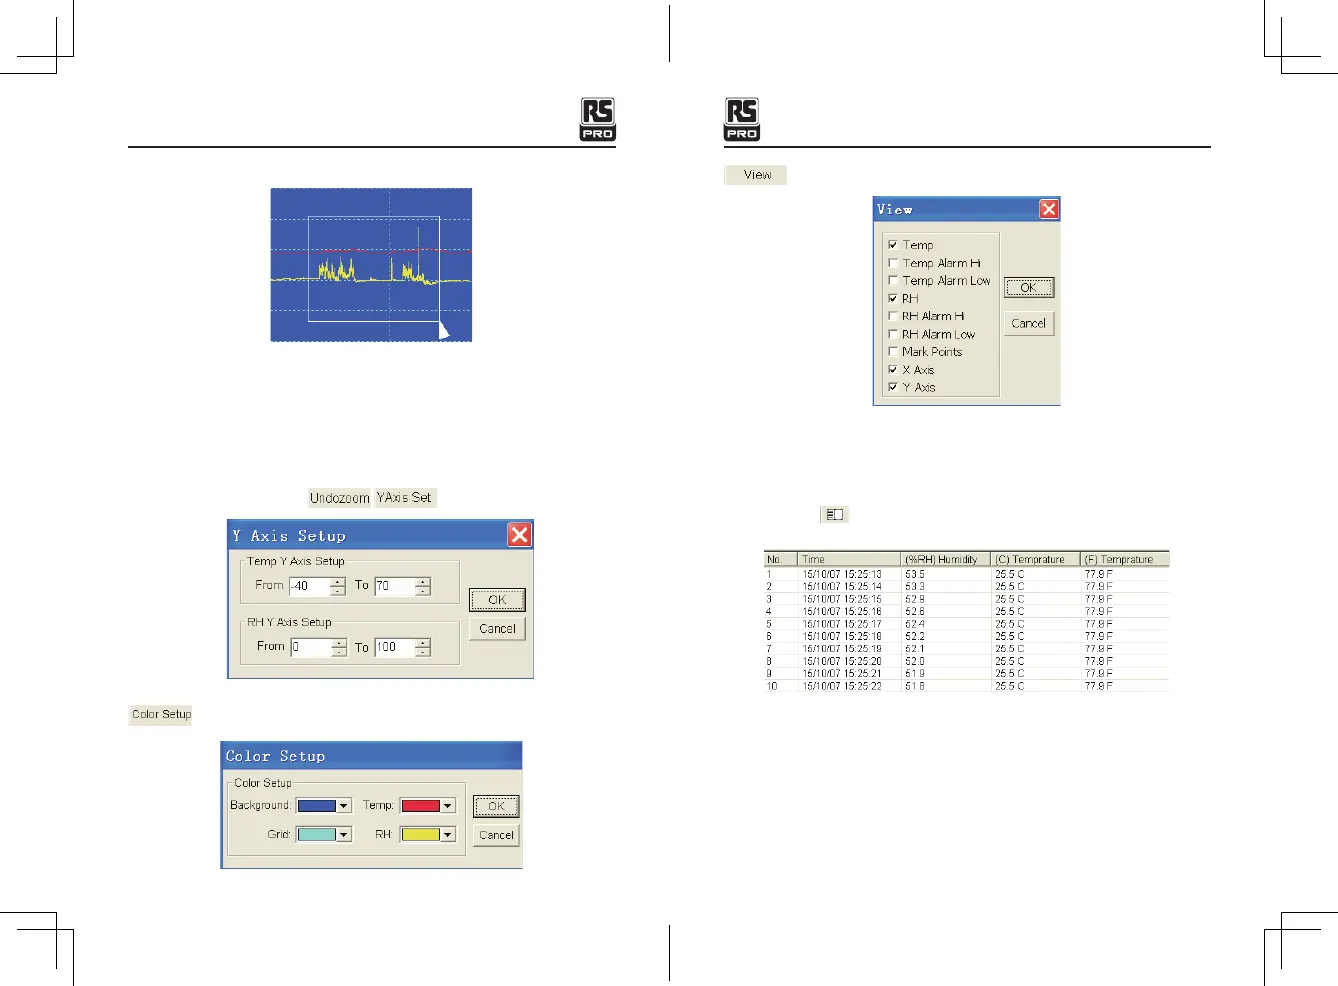
Zoom in:
1. Press the left mouse button and drag a rectangle around the area to be expanded.
2. Release the mouse button.
3. Use the horizontal scrollbar to scroll through all the data.
Use the left vertical scrollbar to scroll through the temperature data.
Use the right vertical scrollbar to scroll through the relative humidity data.
Zoom out
Zoom out to full view by clicking
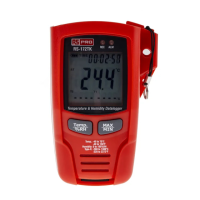
Setup the Temp and RH Y Axis.
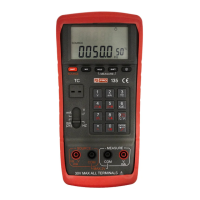
Setup the back ground color, grid color, temp and RH color.
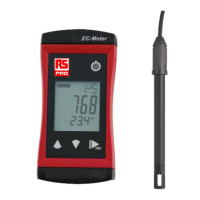
Customize the graph window.
Allows the user to select which data to view as a trace.
Add or remove grid lines from x and y axis.
Mark Points: Places dots on the traces for the actual data points, breaking up the
continuous nature of a trace.
Click the list icon to get the list window.
It shows specific time and data.
Temperature & Humidity Datalogger/EnglishTemperature & Humidity Datalogger/English
22/12/2017 Version No. 00122/12/2017 Version No. 001