14
Measuring in Guest Mode
If all personal memories are already occupied, or if you would like to obtain one-off values
for BMI, body fat and body water for another person, you can perform the measurement
in so-called Guest Mode.:
– Switch on the scale by pressing the
MENU and SET keys simultaneously.
se(a, 8.8.8.8.8. and 0.0 appear consec-
utively in the display. The scale is then
automatically set to zero and the dis-
play shows GUEST.
– Keep the MENU key depressed until
HEIGHT appears in the display.
The display will show the last height
entered.
– You can change the value in the incre-
ments shown by the graduations in the
display using arrow keys ▲ and ▼.
– Once the correct value has been set,
briefly press the SET key.
The menu for gender and build ap-
pears.
– Use arrow keys ▲ and ▼ to select your
gender and your build:
MALE NORMAL: male, normal build,
(exercising a maximum of twice a week
for 30 minutes),
FEMALE NORMAL: female, normal
build, (exercising a maximum of twice a
week for 30 minutes),
MALE ATHLETIC: male and athletic,
FEMALE ATHLETIC: female and athlet-
ic.
– Confirm your selection by briefly press-
ing the SET key.
The menu for entering age appears.
– You can increase or decrease the value
using arrow keys ▲ and ▼.
– Once the correct value has been set,
briefly press the SET key.
This concludes data entry for the per-
sonal data for a guest.
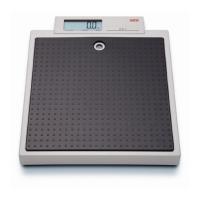
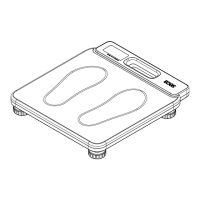
Step onto the scale barefoot and stand
still (see Fig. 6). The scale determines
your weight and subsequently meas-
ures the electrical resistance of your
body tissue. During measuring, the
symbol o moves across the display.
– After successful measurement, the val-
ues for BMI, body fat and body water
are displayed three times consecutive-
ly. The scale then switches off.
– Compare your values with the catego-
ries on pages 14 and 15.
Evaluation of body fat and body water values
The body fat and body water values shown as a percentage of body weight below are
guideline values from the World Health Organisation (WHO).
Body fat:
Women
Age Underweight Healthy Zone Overweight Obese
Age 20 – 40 below 21% 21 – 33% 33 – 39% above 39%
Age 41 – 60 below 23% 23 – 35% 35 – 40% above 40%
Age 61 – 79 below 24% 24 – 36% 36 – 42% above 42%
Men
Age Underweight Healthy Zone Overweight Obese
Age 20 – 40 below 8% 8 – 19% 19 – 25% above 25%
Age 41 – 60 below 11% 11 – 22% 22 – 27% above 27%
Age 61 – 79 below 13% 13 – 25% 25 – 30% above 30%