Page 10
View your historical energy usage
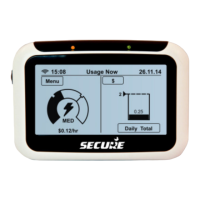
Touch the History icon from the Main Menu screen to view your energy
consumption pattern graphically as well as in tabular form or compare
your current energy consumption with the previous day, week, month
or year.
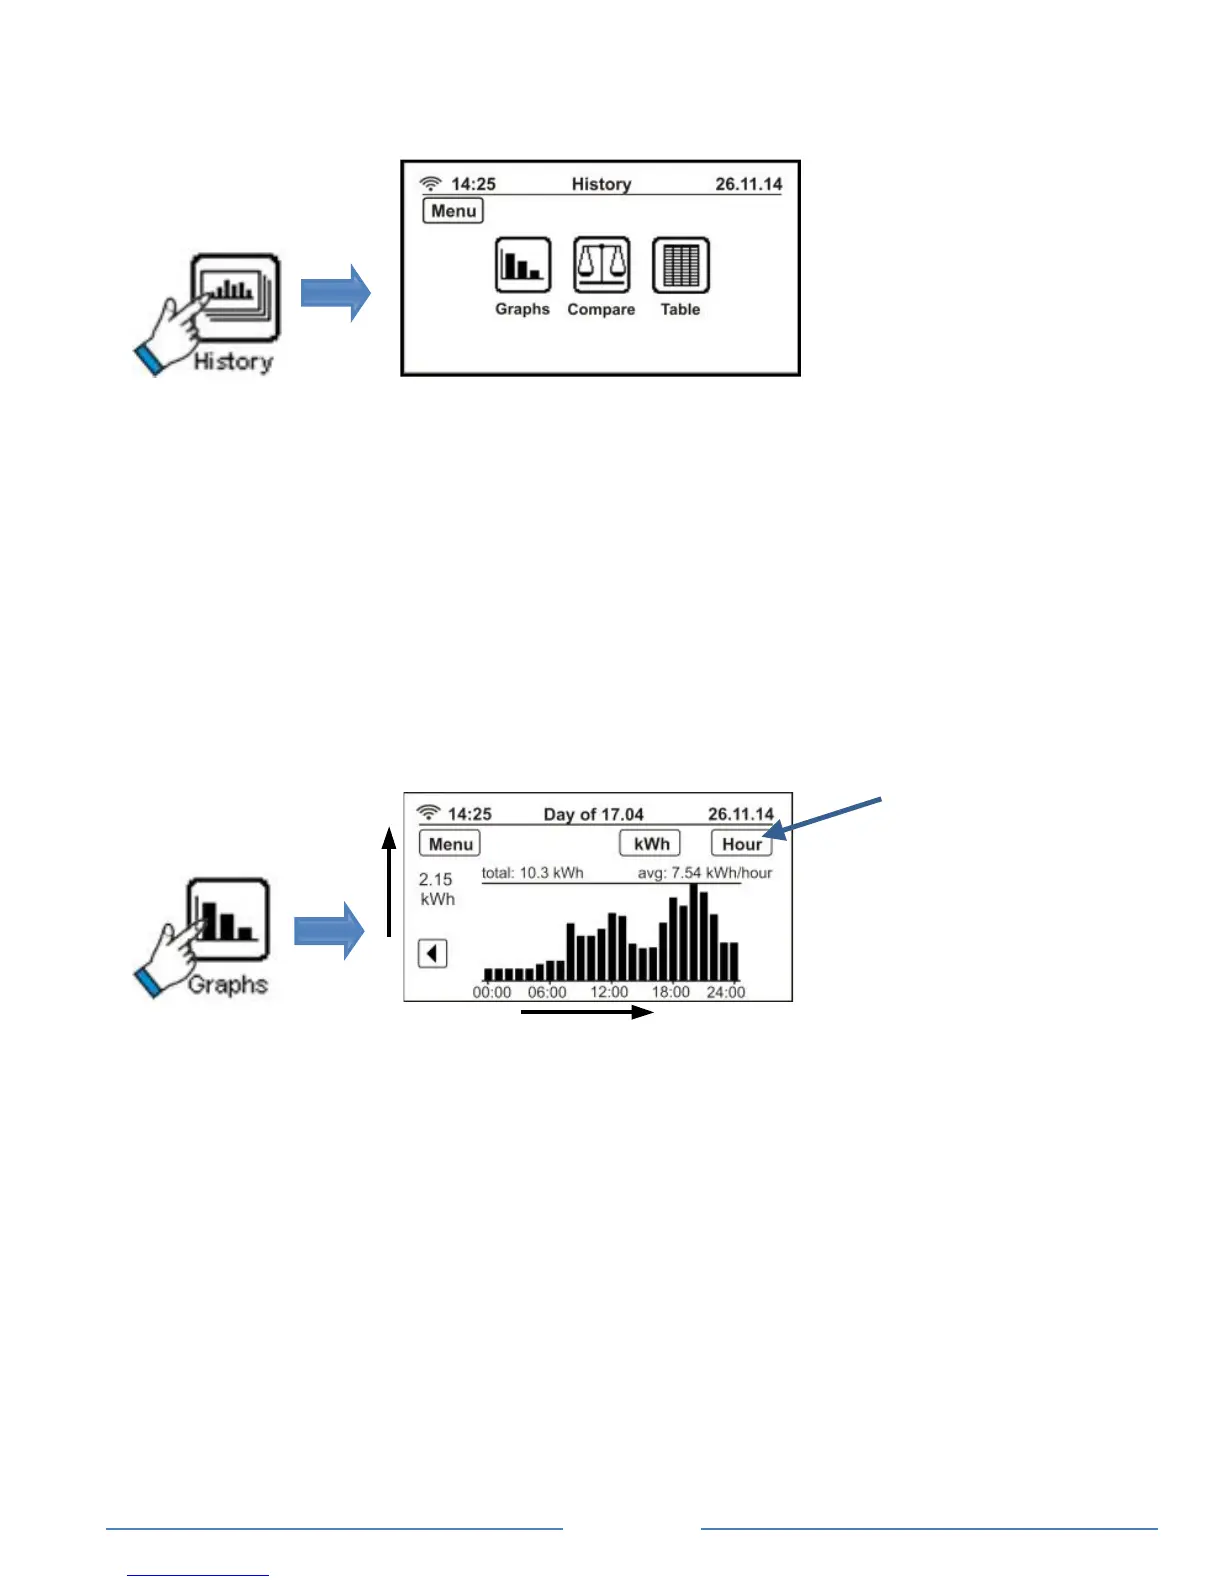
View historical energy usage graphically
Touch the Graphs icon to see your net hourly consumption pattern over
the past 24 hours, and daily consumption along with your daily target
threshold. You can set your own daily consumption target threshold to
help you control your energy consumption and keep your energy bills
low. Use the arrow buttons on either side of the graph to scroll
backwards and forwards through the data.
On the same screen you can also see your daily, weekly and monthly
consumption patterns by using the View button or you can check your
Unit
 Loading...
