Page 11
hourly rate of consumption ($/hour) and carbon emissions by using the
Unit selection button.
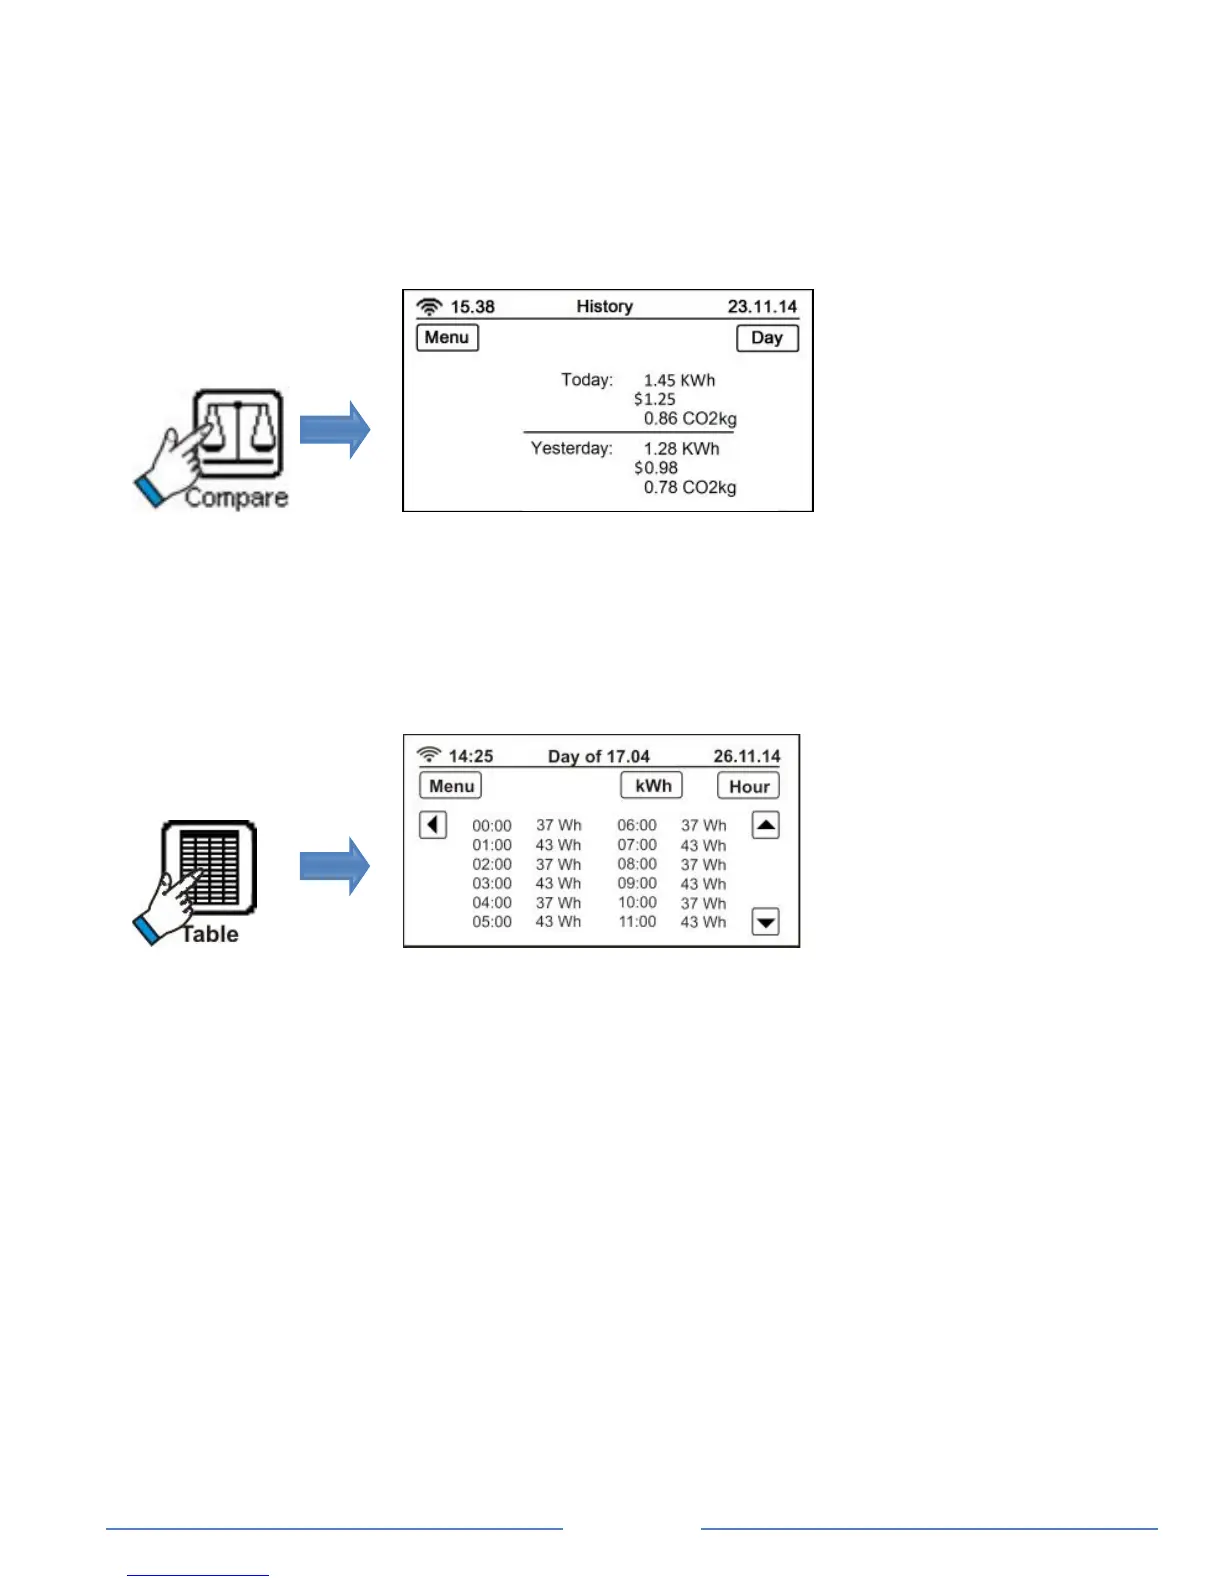
Compare energy usage by day, week, month or year
Touch the Compare icon to compare your current and previous week,
month and year’s consumption by using the View button.
View historical energy usage table
Touch the Table icon to see your hourly consumption pattern in tabular
form over the past 24 hours. Use the View button to see your daily,
weekly and monthly consumption data. To scroll through days use the
left-hand arrow, as shown above.
 Loading...
