16
Basic Keyboard/GENERAL MATHEMATICS USING THE SHARP EL-9900
Copyright © 2002, Sharp Electronics Corporation. Permission is granted to photocopy for educational use only.
Steps for creating a pie chart from count data
STEP 1: Press STAT to enter the statistics menu. Delete old data and enter the
following data set in L1 using weights in L2:
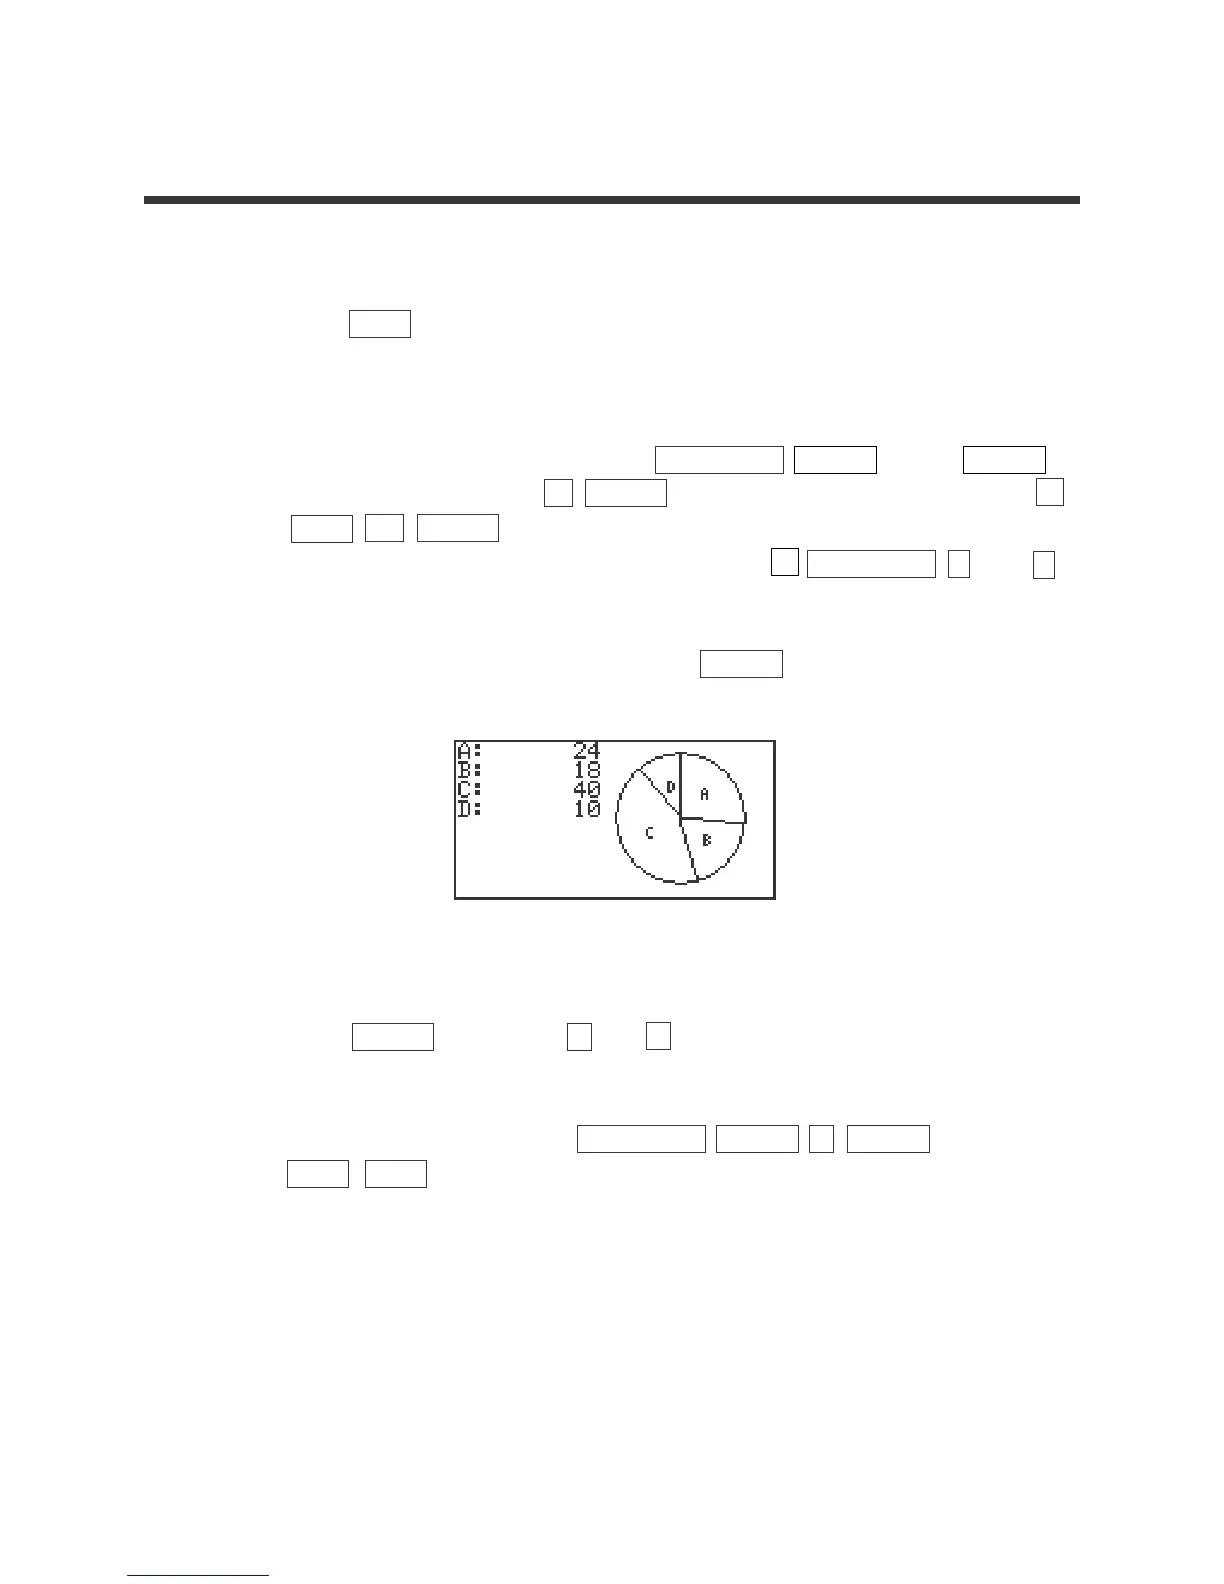
24 18 40 10
STEP 2: To construct a pie chart, first press STAT PLOT ENTER . Press ENTER
to turn PLOT1 on. Press ▼ ENTER to choose one-variable data. Press ▼
2ndF L1 ENTER to enter L1 as the data list. Leave the Freq prompt
blank. Set the graph to a pie chart by pressing ▼ STAT PLOT F (PIE) 1
(PIE) .
STEP 3: To view the pie chart for the data, press GRAPH .
STEP 4: Press TRACE followed by and to highlight and mark the pieces
of the pie chart.
STEP 5: Turn PLOT1 off by pressing STAT PLOT ENTER ENTER
2ndF QUIT .
PIE CHART FOR A
ONE-VARIABLE DATA SET
▼
▼
▼