Running the Analyser 13
THE ANALYSER INTERFACE
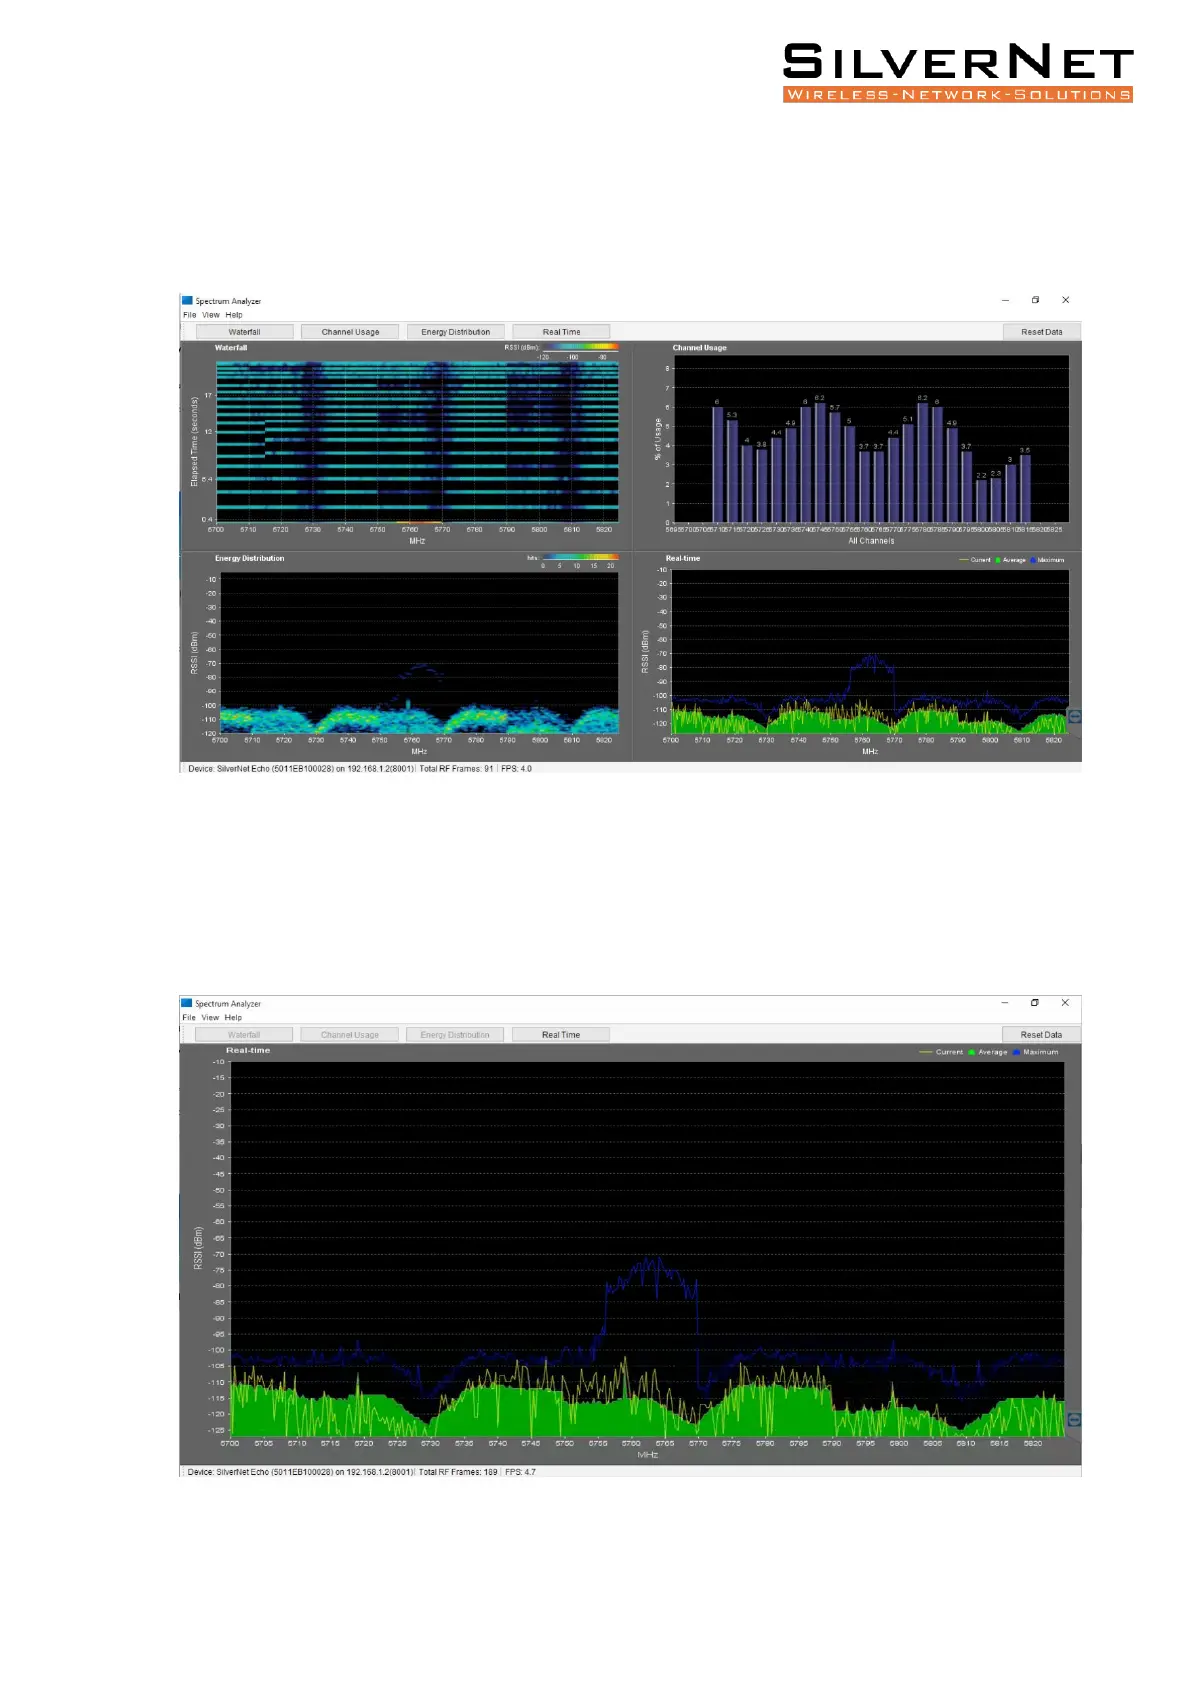
There are four views available and these can be enabled or disabled by selecting the buttons
at the top of the interface.
The Realtime chart displays current noise levels in dBm on each specific channel.
• The yellow lines represent current dBm levels
• The solid green colour indicates the noise average
• The blue lines represent the peak noise level
 Loading...