Home
Solar-Log
Measuring Instruments
250
Solar-Log 250 User Manual
4
of 1
of 1 rating
158 pages
Give review
Manual
Specs
To Next Page
To Next Page
To Previous Page
To Previous Page
Loading...
53
Notifications
3.
1.
1
Explanation of the individual E-mail Functions:
Deactiv
ated
•
When no e-mail notifications are to be sent.
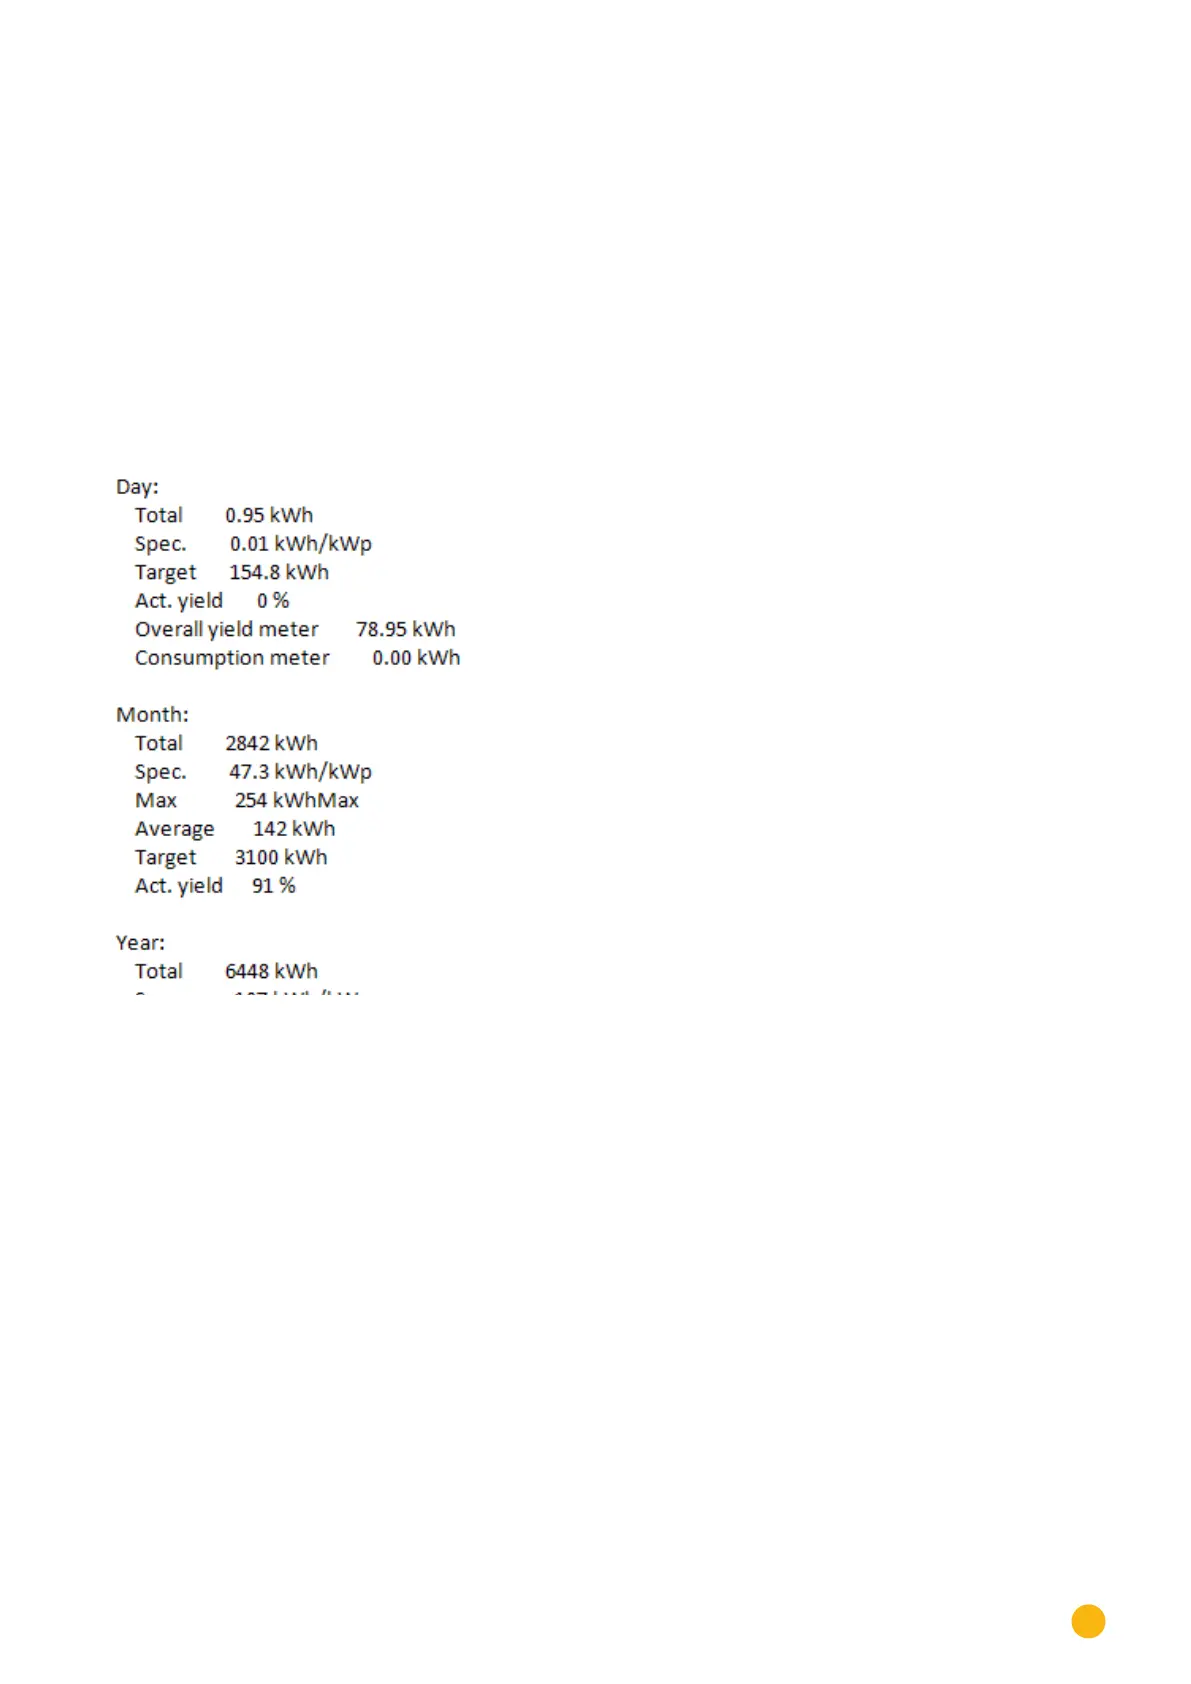
Yield o
v
erview short
•
The yield data from the entire plant is totaled and displayed for the day, month and year. (See Fig.:
Screenshot of a yield message)
Fig.: Example of a yield message
52
54
Table of Contents
Table of Contents
3
1 General Information
7
The Necessary Steps for Precision Monitoring of Your PV Plant with the Solar-Log
8
2 Operating Via a Web Browser Within Your Own Network
9
Requirements
9
Overview
10
General Navigation
10
Fig.: Navigation Designations
10
Fig.: Log in Button with Selection Box
11
Fig.: Header Bar with the "Hide Arrow
11
Access Control
11
Accessing the Start Page
13
Fig.: Welcome Screen
13
Accessing Yield Data
14
Current Values
14
Fig.: the Plant's Current Values
14
Production
15
Fig.: Graphic Display of the Plant's Total Production
15
Day View
16
Fig.: Daily View of the Production Graph with the Auto Scaling Activated
16
Fig.: Day View of the Production Table
17
Month View
18
Fig.: Month View Production Graph
18
Fig.: Month View of the Production Table
19
Year View
20
Fig.: Year View Graph
20
Total View
21
Fig.: Total View Graph
21
Consumption
22
Fig.: Graph of Daily Consumption with Connected Appliances in the Sub-Consumer View
24
Fig.: Daily Balance Graph with the Auto Scaling Activated
26
Day Balance
27
Fig.: Daily Balance Graph with the Auto Scaling Deactivated
27
Month Balance
28
Fig.: Month View Balance Graph
28
Year Balance
29
Fig.: Year View Balance Graph
29
Total Balance
30
Fig.: Total Balance Graph
30
Finances
31
Fig.: Finances Overview
31
Sensor
32
Fig.: Graph of Sensor Box Values
32
System Information
33
Fig.: System Information
33
Accessing Diagnostic Values
34
Inverter Diagnostic
34
Fig.: Inverter Details Graph
35
Fig.: Tracker Comparison Graph
36
Fig.: Module Field Comparison Graph
37
Accessing Event Logs
38
Fig.: the Event Log Is Being Loaded
38
Fig.: Event Log
38
Accessing Notifications
39
Fig.: Notification Overview
39
Fig.: Message with Text Field
40
Accessing Feed-In Management
41
Fig.: Feed-In Management - Control State
41
Fig.: Feed-In Management - Feed-Balance
44
Accessing the SCB Monitor (Only Solar-Log 2000)
45
Accessing Components
46
Fig.: Components - S0 Meter on Interface a and B
46
Fig.: Connection Test - Wireless Package
46
Fig.: Alarm Contact
47
Accessing CSV Export
49
Fig.: CSV Export
49
Accessing Support
50
Fig.: Support - General
50
3 Notifications
51
Yield E-Mail
51
Fig.: Entering the Recipient's E-Mail Address
51
Fig.: Defining Notification Times and Setting Types
52
Explanation of the Individual E-Mail Functions
53
Fig.: Example of a Yield Message
53
Fig.: Yield Overview (All INV) in HTML Format
54
Fig.: Yield Overview (All INV & Groups) in HTML Format
54
Performance Monitoring
57
Fig.: Performance Monitoring: Example Plant with Two Inverters
57
Fig.: Configuring Module Fields
58
Fig.: Configuring Performance Monitoring
58
Performance Monitoring Notification
59
Calculation and Explanation of the Notification
60
Fig.: Performance Monitoring with Notification and Inverter
60
4 Operating the Solar-Log 1200 and 2000 Via Touch Display
61
Navigating from the Touch Screen
61
Fig.: Start Page of the Display
61
Accessing the Dashboard
63
Fig.: Dashboard View
63
Accessing the Energy Balance
64
Fig.: Energy Balance View
64
Accessing Forecast
65
Fig.: Forecast View
65
Accessing Yield History
66
Accessing Environmental Performance
66
Fig.: Yield History - Day
66
Fig.: Environmental Performance - Day View
66
Accessing the USB Menu
68
Fig.: Menu Settings
68
Fig.: USB Menu
68
5 Operating the Solar-Log 500 and 1000 Via the Display
70
Display Solar-Log 500
70
Display Solar-Log 1000
71
How to Navigate with the Touchscreen
71
Accessing Yield Data
72
How to Navigate between Different Overviews
72
The Meaning of the Values in the Overviews
73
Daily Graph
74
Monthly Graph
75
Yearly Graph
76
Overall Graph
77
Large External Display
78
Power Balance
79
Accessing the Diagnosis
80
Accessing Notifications
80
Display the Inverter Events
81
Fig.: Inverter Event Log
81
Handling Alarm Notifications
82
Optimizing the Consumption of Self-Produced Power
83
Using Data Transfer with USB
84
Create a Backup
84
Fig.: USB Backup Selection Menu
84
Fig.: Starting USB Backup
85
Fig.: Importing USB Configuration
85
Fig.: Importing USB Yield Data
86
Fig.: USB Firmware Update
87
Updating the Firmware
87
Changing Settings in the Configuration Menu
88
6 Pac Correction Factor
89
Calculating the PAC Correction Factor
89
7 Using Solar-Log WEB
90
Registering for Solar-Log™ WEB "Classic 2Nd Edition
90
Fig.: C2 Registration
91
Accessing Plant Data
93
Fig.: C2 Plant Search Screen
94
Fig.: C2 Plant Search with a Filter
94
Fig.: C2 Plant Search with Results
95
Fig.: C2 Plant with a Day Curve
96
Accessing Yield Data
97
How to Navigate between Different Overviews
97
The Meaning of the Values in the Overviews
97
Fig.: C2 Navigating in the View
97
Daily Overview
98
Fig.: Day Curve with Additional Values
98
Monthly Overview
99
Fig.: Plant C2 - Monthly Overview
99
Annual Overview
100
Fig.: Plant C2 - Annual Overview
100
Total Overview
101
Fig.: Plant C2 - Total Overview
101
Accessing and Filtering the Event Log
102
Fig.: Plant C2 - Notifications
102
Fig.: Plant C2 - Filtered Notifications
103
8 Using the Solar-Log™ Android App
104
Installing the App
104
Fig.: the App Icon
104
Add Plants
105
Fig.: the App's Toolbar
105
Fig.: Adding a Plant to the App
105
Fig.: Entering the Plant's Access Data
105
Plant Settings
106
S0 Meter
106
Fig.: Entering the Plant Name in the App
106
Fig.: S0 Meter Settings
106
Administration
107
Fig.: Management Settings
107
The Toolbar
108
Fig.: Toolbar
108
Accessing Yield Values
109
Fig.: Day Curve with a Menu Selection
109
Daily Overview
110
Monthly Overview
110
Fig.: Day Curve
110
Fig.: Monthly Overview as a Bar Graph
110
Annual Overview
111
Fig.: Annual Overview as a Bar Graph
111
Total Overview
112
Fig.: Total Overview as a Bar Graph
112
Viewing CO2 Savings
113
Fig.: Avoided C02 Emissions
113
App Settings
114
Fig.: General Settings
114
Periodical Data Update
115
Reset
115
Fig.: Periodical Data Update Settings
115
Fig.: Reset Function
115
Slide Show
116
Fig.: Slide Show Settings
116
Legal Disclaimer
117
The Yield Data as a Slide Show
117
Fig.: Legal Disclaimer
117
Fig.: Slide Show Format
117
Using the Android App with a Smartphone
118
Smartphone Vertical Format
118
Fig.: View of the Smartphone in the Vertical Format
118
Smartphone - Horizontal Format
119
Fig.: Selection Via the Menu Button
119
Solar-Log™ Widget for Smartphones
120
9 Using the Solar-Log™ App Iphone V3 for Iphones
121
Installing the App
121
Fig.: the App Icon
121
Add Plants
122
Fig.: Saved Plants
122
Fig.: Add Plants
123
Accessing Yield Data
124
How to Navigate between Different Overviews
124
The Top Menu Bar
126
Fig.: Plant Settings
126
The Bottom Menu Bar
127
Daily Overview
127
Monthly Overview
128
Fig.: Monthly Overview in Horizontal Format
128
Annual Overview
129
Fig.: Annual Overview in Horizontal Format
129
Total Overview
130
Fig.: Total Overview in Horizontal Format
130
Viewing CO2 Savings
131
Fig.: CO2 Savings
131
Viewing Plant Data
132
Fig.: Plant Data
132
Fig.: Display Settings
133
The Yield Data as a Slide Show
134
Fig.: Slide Show Settings
134
Start the Slide Show
135
Fig.: Screen with the Top and Bottom Menu Selection
135
10 Cleaning and Care
136
Cleaning Tips
136
Care Tips
136
11 Notifications on the LCD Status Display
137
Meaning of the Symbols on the LCD Display
137
Fig.: LCD Status Display with All of the Symbols
137
12 Faults (Solar-Log 200, 500 and 1000)
140
LED Status Display (Solar-Log 200, 500 and 1000)
140
Troubleshooting Faults Oneself
141
Obtaining Information from the Internet
142
Informing a Specialist Technician
143
13 Disposal
144
14 Technical Data (Solar-Log 300, 1200 and 2000)
145
15 Technical Data (Solar-Log 200, 500 and 1000)
151
16 List of Figures
156
List of Figures
157
Other manuals for Solar-Log 250
Manual
319 pages
Installation Manual
224 pages
Connection Manual
24 pages
4
Based on 1 rating
Ask a question
Give review
Questions and Answers:
Need help?
Do you have a question about the Solar-Log 250 and is the answer not in the manual?
Ask a question
Solar-Log 250 Specifications
General
Max. Number of Inverters
10
Data Logging
Yes
Maximum Input Power
25000 W
Max. DC Power
25000 W
Communication Interfaces
Ethernet
Protocols
Modbus TCP
Related product manuals
Solar-Log 200
319 pages
Solar-Log 2000
319 pages
Solar-Log 300
158 pages
Solar-Log PRO380-CT
4 pages
Solar-Log Pro 380
4 pages
Solar-Log 1200
319 pages
Solar-Log 500
319 pages

 Loading...