5
PERFORMANCE DATA
Table 2
Input Output
(Max.) (Min.) Min. Temp. Rise P.D. Max. Temp. Rise P.D.
Unit MBH MBH MBH CFM Deg. F. in. of W.C. CFM Deg. F. in. of W.C.
Size (kW) (kW) (kW) (cu. m/s) (Deg. C.) (kPa) (cu. m/s) (Deg. C.) (kPa)
100 100 50 80 822 90 0.10 3,700 20 2.03
(29.3) (14.6) (23.4) (0.388) (50) (0.02) (1.746) (11) (0.51)
125 125 62.5 100 1,028 90 0.09 4,625 20 1.92
(36.6) (18.3) (29.3) (0.485) (50) (0.02) (2.183) (11) (0.48)
150 150 75 120 1,233 90 0.09 5,550 20 1.81
(43.9) (22.0) (35.1) (0.582) (50) (0.02) (2.620) (11) (0.45)
175 175 87.5 140 1,439 90 0.09 6,475 20 1.86
(51.2) (25.6) (41.0) (0.679) (50) (0.02) (3.056) (11) (0.46)
200 200 100 160 1,645 90 0.09 7,401 20 1.90
(58.6) (29.3) (46.9) (0.776) (50) (0.02) (3.493) (11) (0.47)
225 225 112.5 180 1,850 90 0.09 8,326 20 1.93
(65.9) (32.9) (52.7) (0.873) (50) (0.02) (3.930) (11) (0.48)
250 250 125 200 2,056 90 0.09 9,251 20 1.96
(73.2) (36.6) (58.6) (0.970) (50) (0.02) (4.366) (11) (0.49)
300 300 150 240 2,467 90 0.10 11,101 20 2.00
(87.8) (43.9) (70.3) (1.164) (50) (0.02) (5.240) (11) (0.50)
350 350 175 280 2,878 90 0.10 12,951 20 2.02
(102.5) (51.2) (82.0) (1.358) (50) (0.02) (6.113) (11) (0.50)
400 400 200 320 3,289 90 0.10 14,801 20 2.05
(117.1) (58.6) (93.7) (1.552) (50) (0.02) (6.986) (11) (0.51)
NOTE:
Ratings are shown for elevations up to 2,000 feet (610M) above sea level. Above 2,000 feet (610M), input must be derated 4% for
each 1,000 feet (305M) above sea level. When units are installed in Canada, any reference to derations at altitudes in excess of 2,000
feet (610M) are to be ignored. At altitudes of 2,000 to 4,500 feet (610 to 1372M), the units must be orificed to 90% of the normal
altitude rating, and be so marked in accordance with the ETL certifi cation.
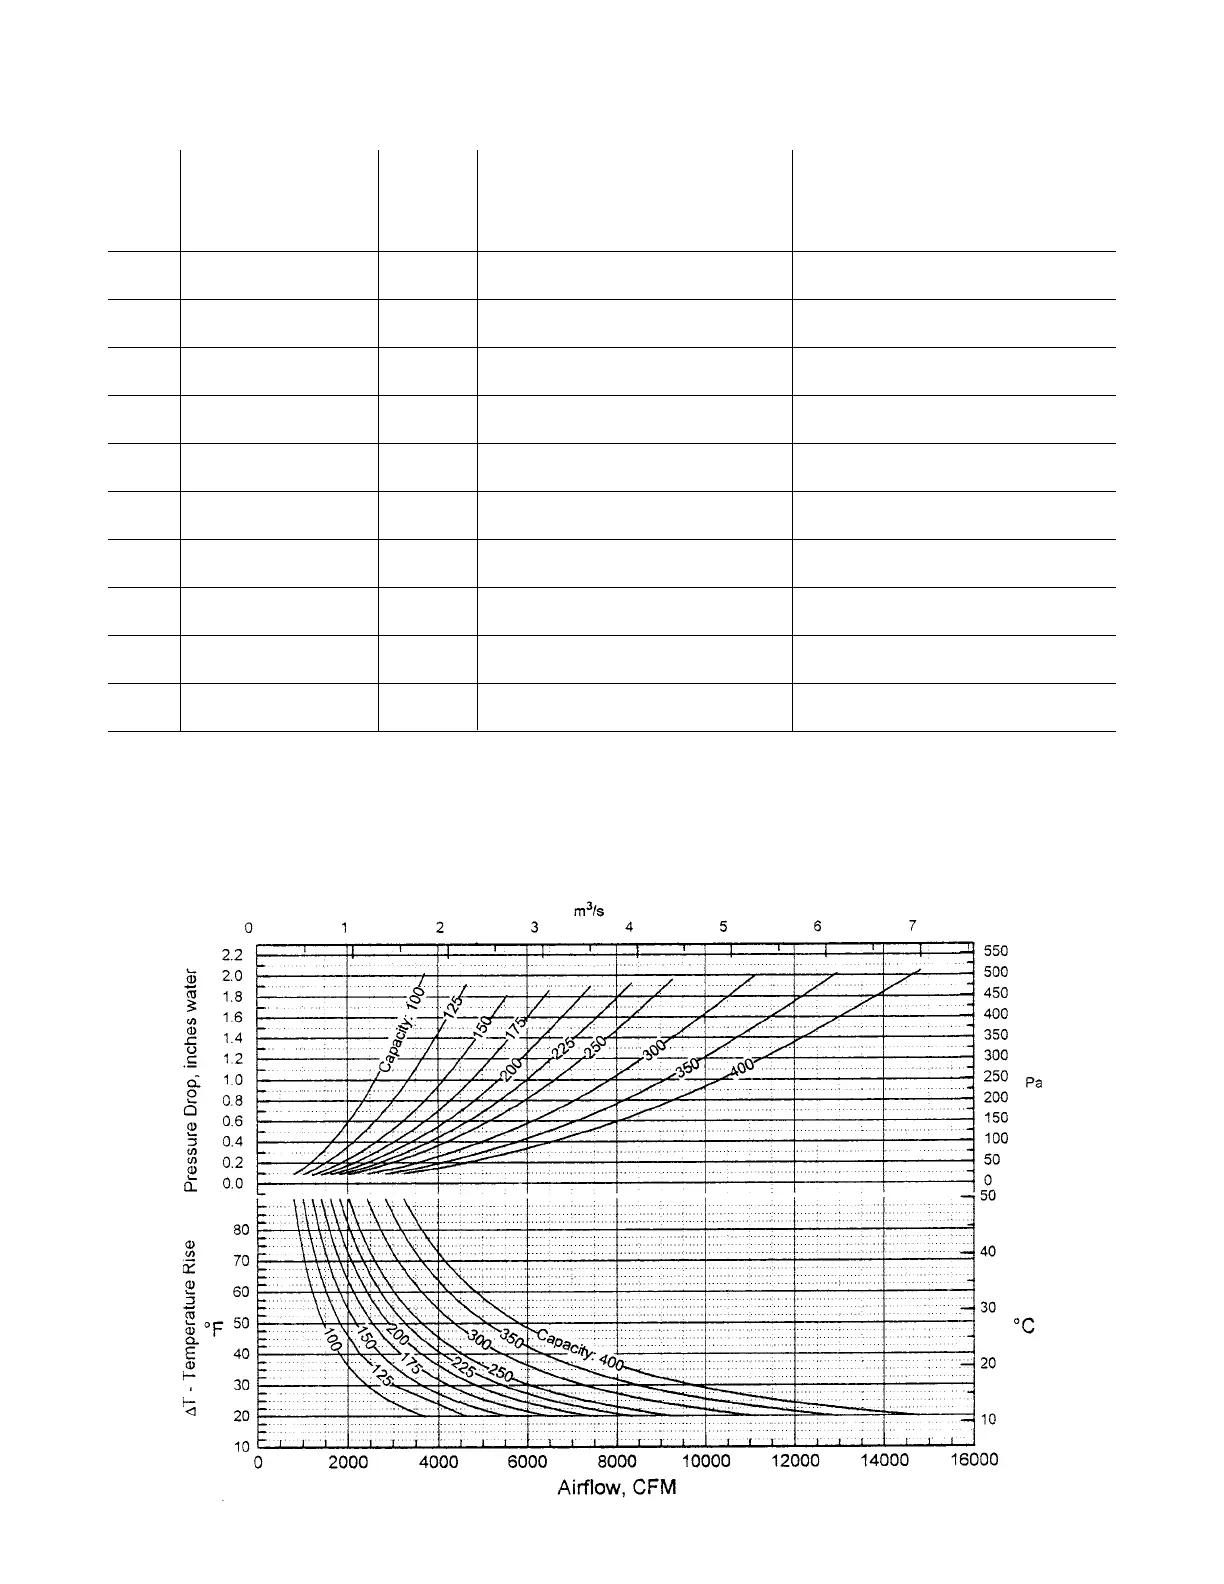
TEMPERATURE RISE AND PRESSURE DROP-GRAPH #1
 Loading...