Do you have a question about the Teledyne Lecroy HDO6000 and is the answer not in the manual?
Icons that alert to important safety concerns on the instrument or in documentation.
Guidelines to avoid personal injury or equipment damage.
Details on AC power requirements, consumption, and grounding.
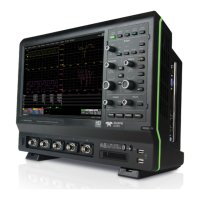
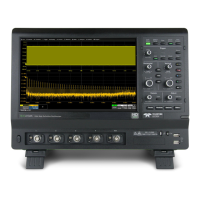
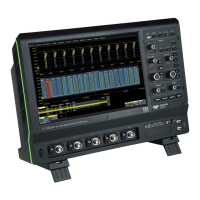
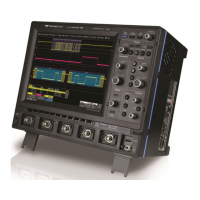
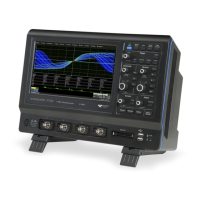
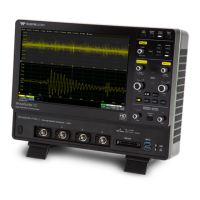
Identification of ports and features on the oscilloscope's front panel.
Identification of ports and features on the oscilloscope's side panel.
Identification of ports and features on the oscilloscope's back panel.
Overview of connectors for inputting analog or digital signals.
Description of front panel controls for trigger, horizontal, and adjustments.
Controls for math functions, vertical settings, and cursor management.
Procedures for turning the instrument on/off and software licensing.
Steps for connecting external devices and changing system language.
Overview of the touch screen's major control groups: Menu bar, Grid, Descriptors, Dialogs.
Details on the menu bar functions, grid area, and descriptor boxes.
Details on setup dialogs, subdialogs, and the action toolbar for common tasks.
Methods for adding, activating, copying, and moving traces.
Adjusting cursor positions and modifying trigger source and level.
Navigating the trace by dragging it horizontally or vertically.
Using the zoom dialog and methods for creating zoom traces.
Understanding active vs. foreground traces and their interactions.
Procedures for enabling and disabling analog, digital, and other trace types.
Techniques for relocating traces between grids and adding annotations.
Quickly configures essential acquisition settings based on input signal.
Accessing instrument status and adjusting vertical scale/offset.
Detailed vertical setup, coupling, bandwidth, and probe attenuation settings.
Applying noise filters and using probe auto-zero/degauss functions.
Displaying digital lines, configuring groups, and choosing display modes.
Customizing labels for digital lines and reassigning physical leads.
Configuring timebase, sampling modes (Real Time, Sequence, RIS, Roll).
Configuring internal or external clock sources for synchronization.
Understanding trigger modes (Single, Normal, Auto, Stop) and types.
Configuring smart triggers, setting up conditions, and selecting sources.
Defining trigger coupling, slope, voltage level, and hysteresis settings.
Details on MultiStage, Measurement, TV, and Serial triggers.
Using time or event counts to temporarily disable triggers after arming.
Configuring holdoff by time or events and counter start conditions.
Steps to change triggers created by TriggerScan.
Configuring grid arrangements, intensity, and axis labels.
Applying persistence effects to waveform traces for historical view.
Adjusting trace style, creating XY plots, and selecting sequence display modes.
Setting up and managing math functions (Fx) for waveform analysis.
Applying continuous or summed averaging as a math function.
Defining parameters, using custom scripts for calculations.
Accessing measurements, defining parameters, and enabling statistics.
Constraining measurements using gates or waveform states.
Creating bar charts to visualize the distribution of measured values.
Visualizing parameter values over time (Track) or acquisitions (Trend).
An alphabetical list of standard measurements and their descriptions.
Storing waveforms to memory slots (Mx) for later viewing.
Recalling saved memories from internal slots to the oscilloscope display.
Searching for unusual events using WaveScan, Edge Mode, and other scan modes.
Defining pass/fail criteria using masks and parameter comparisons.
Configuring the Spectrum Analyzer for frequency domain analysis.
Identifying and annotating frequency peaks and interest points.
Saving trace data to internal memory or external files in various formats.
Saving oscilloscope configurations to internal memory or .LSS files.
Exporting tabular measurement data and screen captures to files.
Automating waveform and table data saving upon trigger events.
Restoring waveform and setup data from files or memory.
Creating LabNotebooks and generating reports from data.
Configuring email settings and sharing files from the instrument.
Managing files and folders, and selecting file paths and names.
Accessing utility functions and viewing instrument status information.
Configuring instrument control via network protocols like TCPIP or USBTMC.
Configuring auxiliary ports and selecting calibration output signals.
Setting instrument date/time and installing software options.
Managing instrument files and configuring appearance/performance settings.
Configuring how offset and delay indicators behave relative to voltage or divisions.
Periodically calibrating the touch screen for accuracy and responsiveness.
Procedures for restarting the application or rebooting the instrument.
Contacting technical support and accessing online manuals, tutorials, and videos.
Information on locating service centers and sales partners.
Electromagnetic Compatibility standards and declarations for the instrument.
Low voltage safety requirements and UL certification details.
End-of-life handling, WEEE, and RoHS compliance information.
Information on product warranty terms, exclusions, and limitations.
Details on patents and software license agreements.
| Vertical Resolution | 12-bit |
|---|---|
| Vertical Sensitivity | 1 mV/div to 10 V/div |
| Input Coupling | AC, DC, GND |
| Operating System | Windows 10 |
| Channels | Up to 4 channels |
| Display Size | 12.1 inches |
| Display Type | Touchscreen |
| Input Impedance | 1 MΩ || 13 pF, 50 Ω |
| Max Input Voltage | 400 V (DC + AC peak) |
| Timebase Accuracy | 5 ppm |
| Trigger Types | Edge, Pulse Width, Window, Runt, Slew Rate, Interval, Dropout, Pattern, State |
| Connectivity | USB, LAN, GPIB (optional) |
| Weight | 6.8 kg (15 lbs) |