The TI-82 can graph piecewise-defined functions by using the options in the TEST menu (Figure I.22) that
is displayed by pressing 2nd TEST. Each TEST function returns the value 1 if the statement is true, and the
value 0 if the statement is false.
Figure I.22: 2nd TEST menu
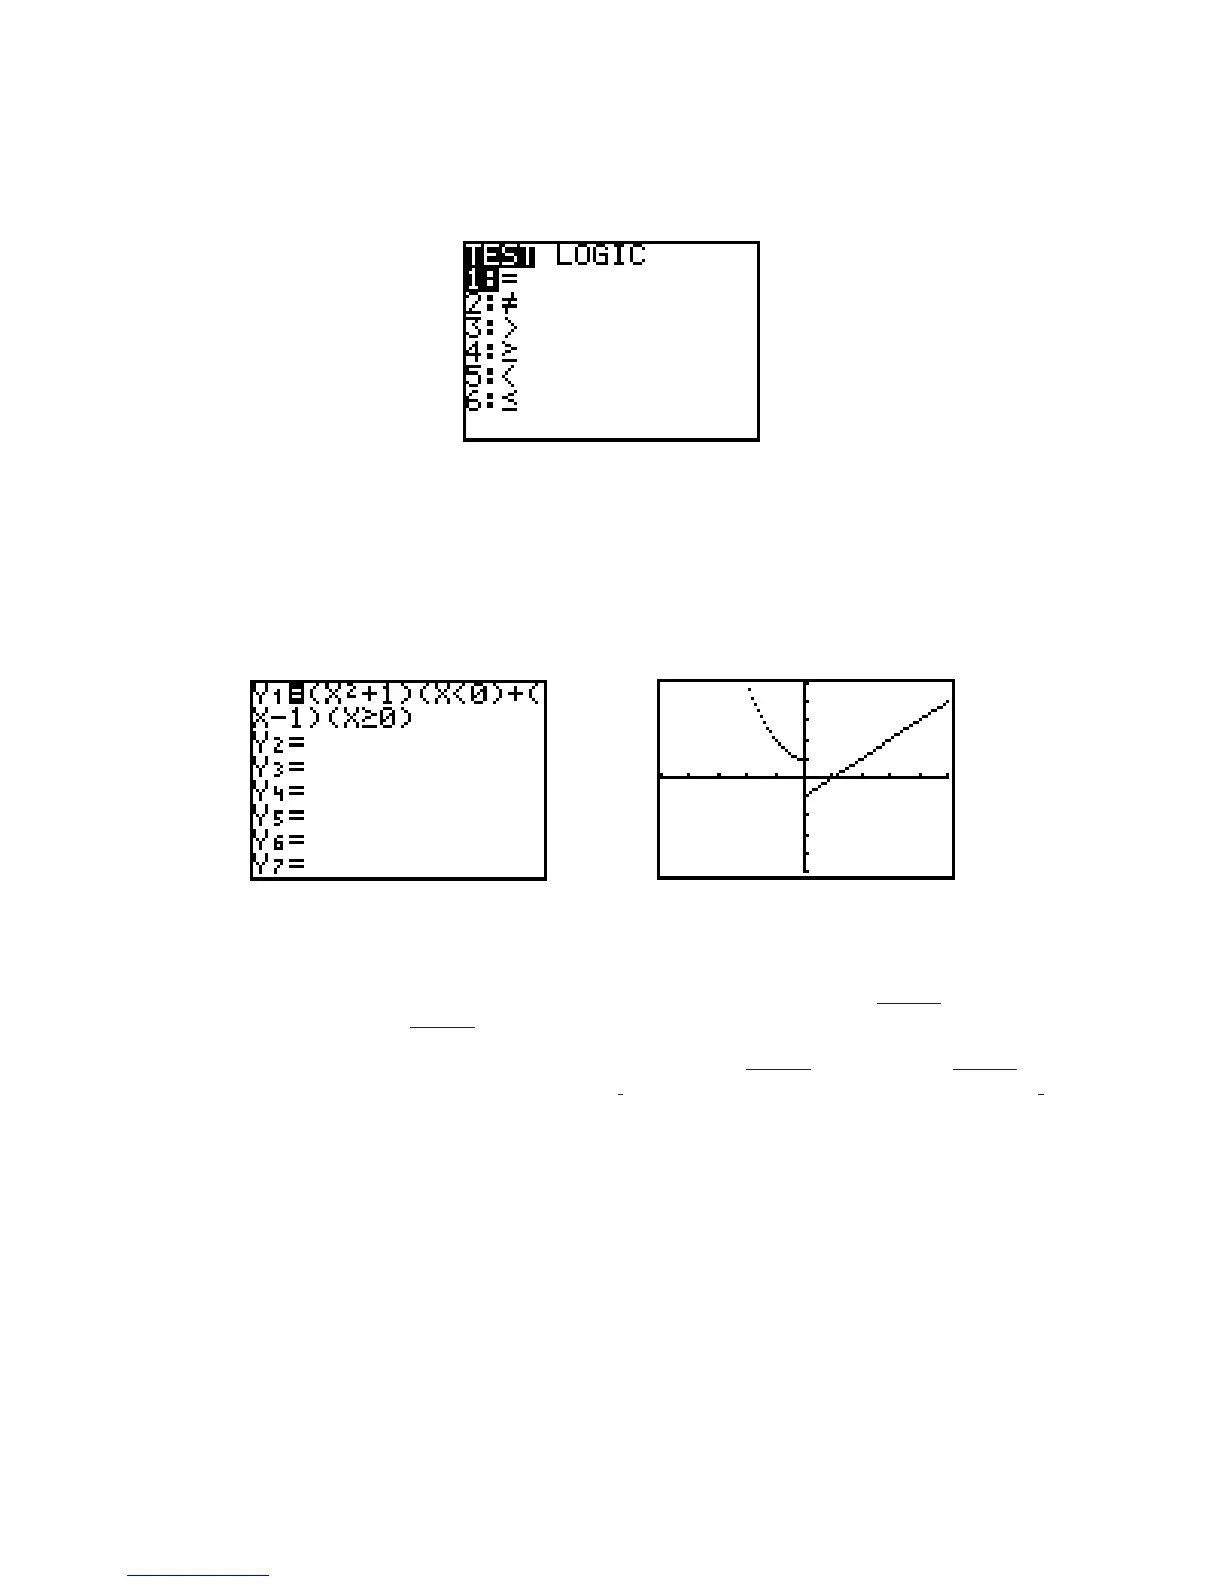
For example, to graph the function (using Dot graph) enter the following keystrokes
Y= ( X,T, + 1) ( X,T, 2nd TEST 5 0 ) + ( X,T, – 1 ) ( X,T, 2nd TEST 4 0 ) (Figure I.23). Then
change the mode to Dot graph and press GRAPH to display the graph. Figure I.24 shows this graph in a
viewing window from to 5 in both directions.
Figure I.23: Piecewise-defined function Figure I.24: Piecewise-defined graph
I.2.4 Graphing a Circle: Here is a useful technique for graphs that are not functions, but that can be “split”
into a top part and a bottom part, or into multiple parts. Suppose you wish to graph the circle whose equation
is First solve for and get an equation for the top semicircle, and for the
bottom semicircle, Then graph the two semicircles simultaneously.
Use the following keystrokes to draw the circle’s graph. Enter as and as
(see Figure I.25) by pressing Y= CLEAR 2nd ( 36 X,T, ) ENTER CLEAR (-) 2nd
( 36 X,T, ). Then press GRAPH to draw them both. x
2
x
2
Y
2
36 x
2
Y
1
36 x
2
y
36 x
2
.
y
36 x
2
,yx
2
y
2
36.

 Loading...


