Figure I.29: Free-moving cursor
Remove the free-moving cursor and its coordinates from the window by pressing GRAPH, CLEAR,or
ENTER. Press an arrow key again and the free-moving cursor will reappear at the same point you left it.
Figure I.30: TRACE
Press TRACE to enable the left and right arrow keys to move the cursor from point to point along the
graph of the function. The cursor is no longer free-moving, but is now constrained to the function. The
coordinates that are displayed belong to points on the function’s graph, so the coordinate is the calculated
value of the function at the corresponding coordinate (Figure I.30).
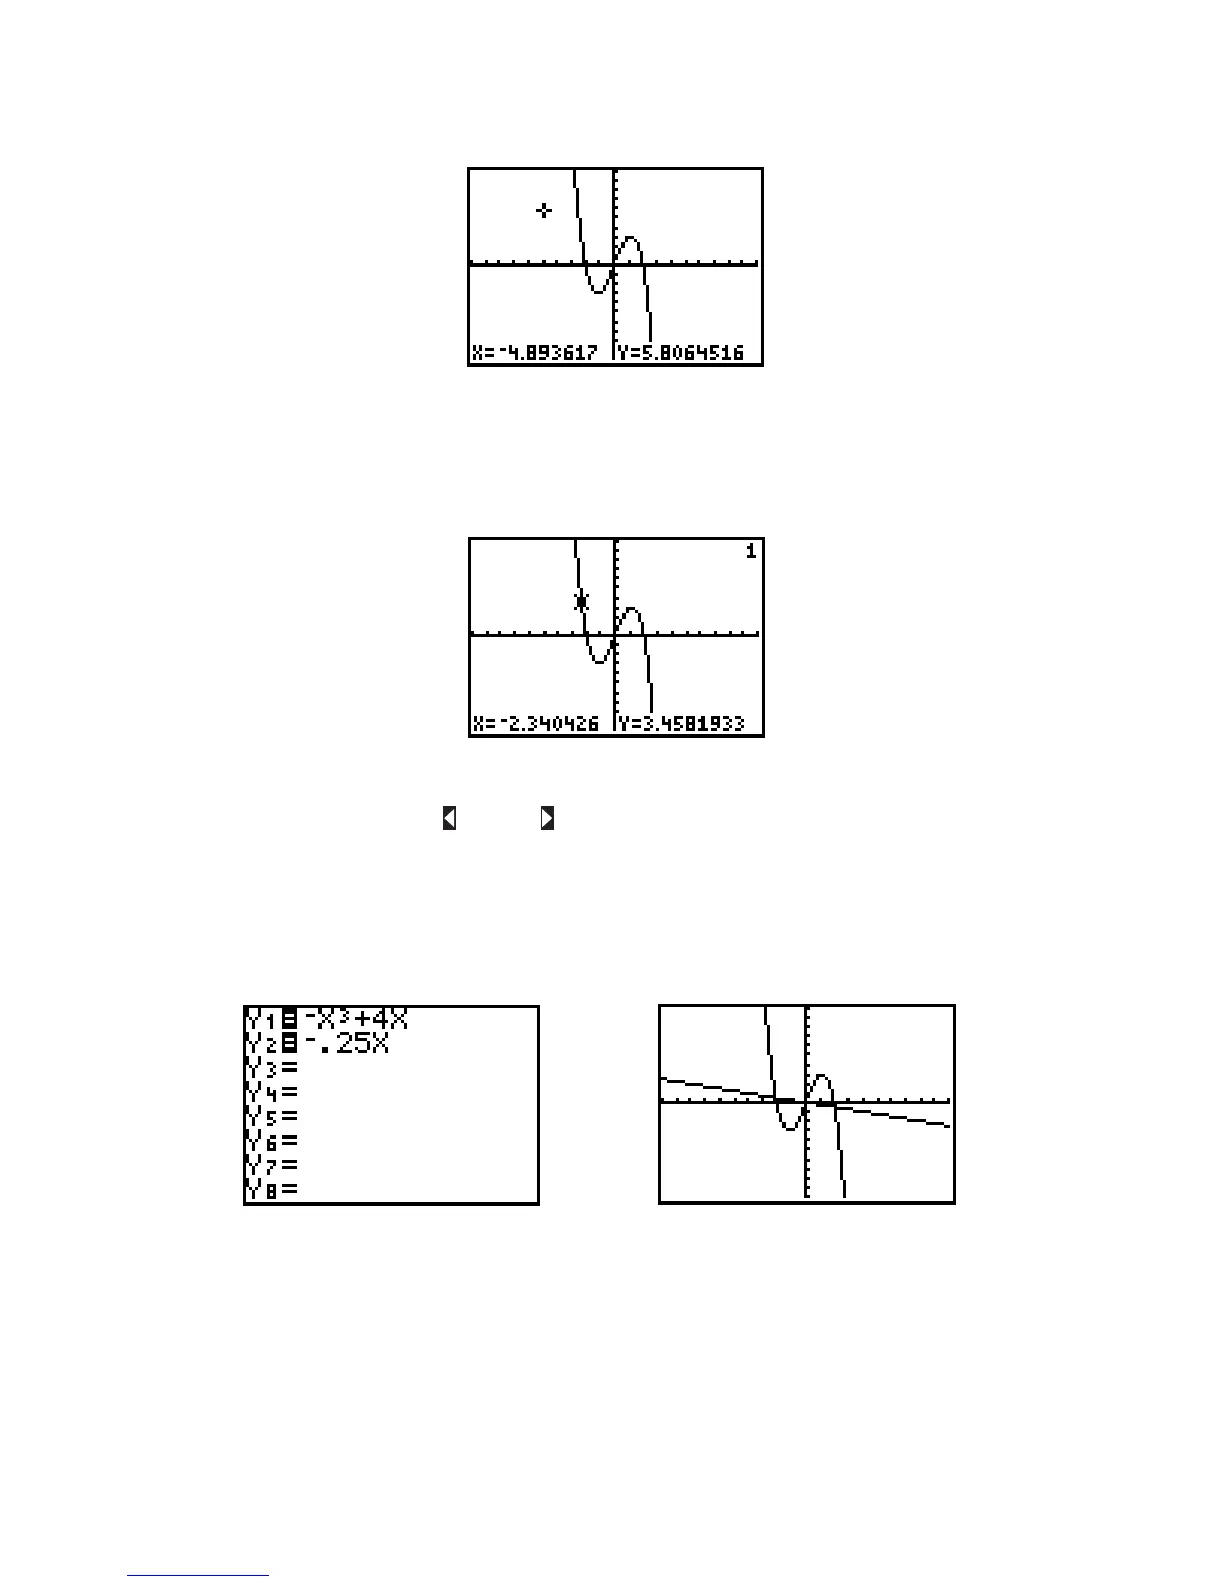
Now plot a second function, along with Press Y=,move the cursor to the line,
and enter then press GRAPH to see both functions.
Figure I.31: Two functions Figure I.32: and
Note in Figure I.31 that the equal signs next to and are both highlighted. This means both functions
will be graphed as shown in Figure I.32. In the Y= screen, move the cursor directly on top of the equal sign
next to and press ENTER. This equal sign should no longer be highlighted (see Figure I.33). Now press
GRAPH and see that only is plotted (Figure I.34).Y
2
Y
1
Y
2
Y
1
y .25xy x
3
4x

 Loading...


