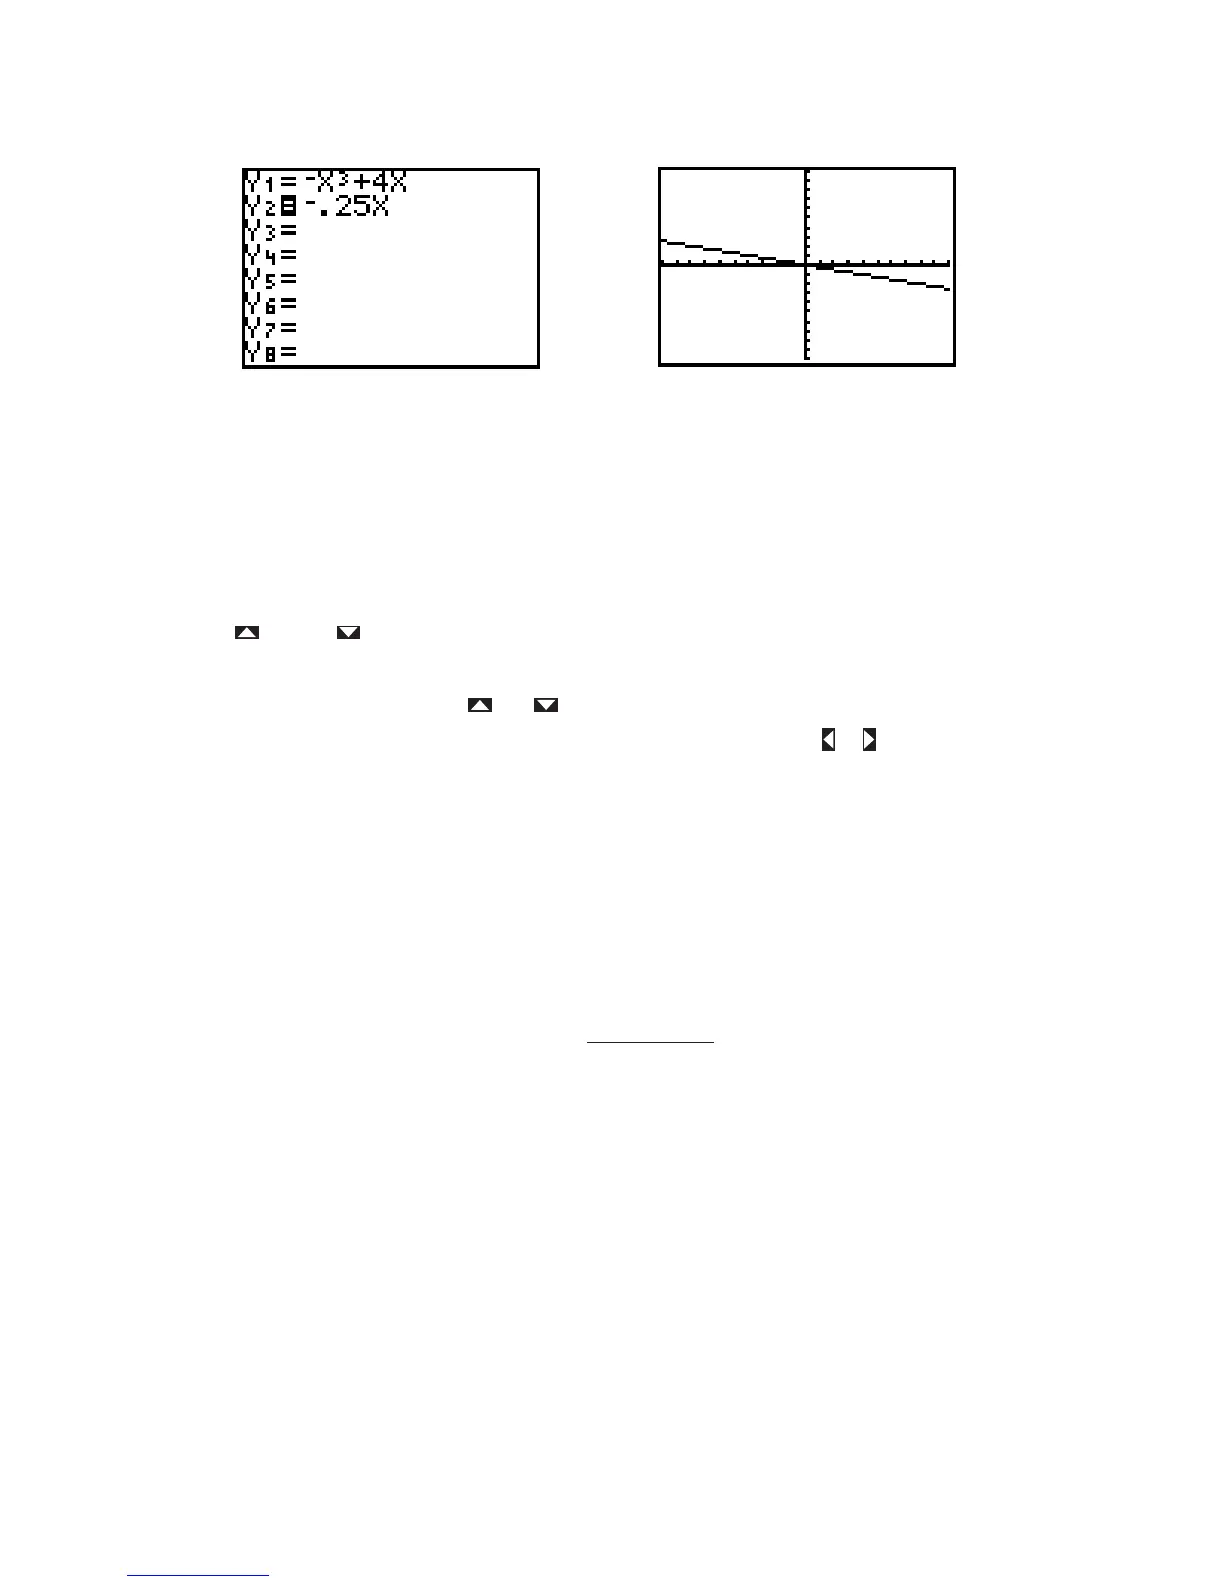
Figure I.33: Y= screen with only active Figure I.34: Graph of
Many different functions can be stored in the Y= list and any combination of them may be graphed
simultaneously. You can make a function active or inactive for graphing by pressing ENTER on its equal
sign to highlight (activate) or remove the highlight (deactivate). Now go back to the Y= screen and do what
is needed in order to graph but not
Now activate both functions so that both graphs are plotted. Press TRACE and the cursor appears first on
the graph of because it is higher up in the Y= list. You know that the cursor is on this function,
, because of the numeral 1 that is displayed in the upper right corner of the screen (see Figure I.30). Press
the up or down arrow key to move the cursor vertically to the graph of Now the numeral
2 is displayed in the upper right corner of the screen. Next press the left and right arrow keys to trace along
the graph of When more than one function is plotted, you can move the trace cursor vertically
from one graph to another with the and keys.
Technology Tip: Trace along the graph of and press and hold either or . Eventually you will
reach the left or right edge of the window. Keep pressing the arrow key and the TI-82 will allow you to
continue the trace by panning the viewing window. Check the WINDOW screen to see that Xmin and Xmax
are automatically updated.
If you trace along the graph of the cursor will eventually move above or below the viewing
window. The cursor’s coordinates on the graph will still be displayed, though the cursor itself can no longer
be seen. When you are tracing along a graph, press ENTER and the window will quickly pan over so that
the cursor’s position on the function is centered in a new viewing window. This feature is especially helpful
when you trace near or beyond the edge of the current viewing window.
The TI-82’s display has 95 horizontal columns of pixels and 63 vertical rows. So when you trace a curve
across a graph window, you are actually moving from Xmin to Xmax in 94 equal jumps, each called You
would calculate the size of each jump to be . Sometimes you may want the jumps to
be friendly numbers like 0.1 or 0.25 so that, when you trace along the curve, the coordinates will be
incremented by such a convenient amount. Just set your viewing window for a particular increment by
making Xmax = Xmin For example, if you want Xmin and set Xmax
Likewise, set Ymax = Ymin 62 if you want the vertical increment to be
some special
To center your window around a particular point, and also have a certain set Xmin = 47
and Xmax Likewise, make Ymin and Ymax For example,
to center a window around the origin with both horizontal and vertical increments of 0.25, set the
range so that Xmin Xmax Ymin
and Ymax 0 31
0.25 7.75.7.75,
0 31
0.25 0 47
0.25 11.75, 0 47
0.25 11.75,
0, 0),
k 31
y. k 31
y h 47
x.
xhx,
h, k),
y.
y
5 94
0.3 23.2.
x 0.3,5 94
x.
x
x-
Xmax Xmin
94
x
x.
y x
3
4x,
y .25x
y .25x.
y .25x.
Y
1
y x
3
4x
Y
2
.Y
1
y .25xY
2

 Loading...


