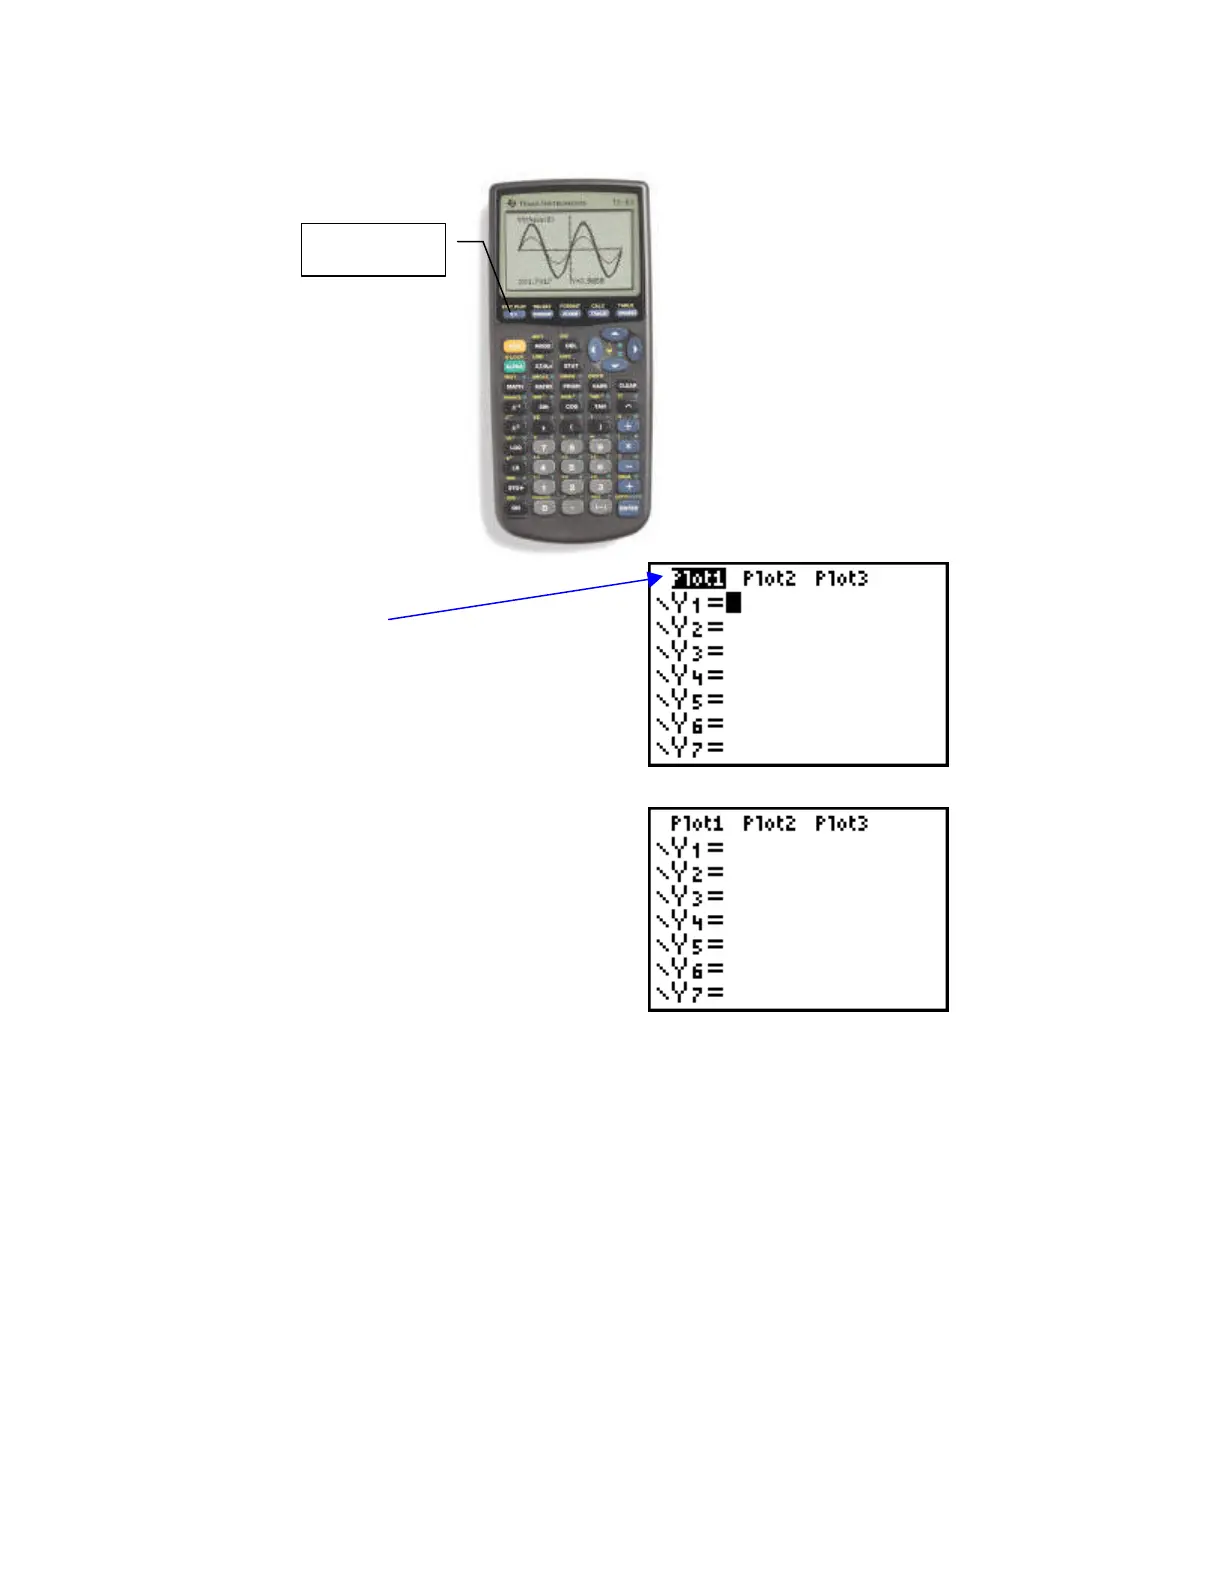
You should see the following on your screen:
The highlighted Plot1 means StatPlot is on.
To turn it off use the up arrow to put the
cursor on Plot1 and hit enter.
Move the cursor back down to Y
1
= and your
screen should look like this:
In Y
1
, type in the following order (consult the figure for the location of these buttons)
1. ( - )
2. 2
3. X,T,θ,n
4. x
2
5. +
6. 1
7. 2
Y =