- 19 -
Graphing Functions and Setting the Window
Graphing Functions and Setting the WindowGraphing Functions and Setting the Window
Graphing Functions and Setting the Window
Once a function is entered in
Y=,
graph the function by pressing
GRAPH.
If more than one
equation is entered in
Y=
, the calculator will graph all of them, unless the user turns off the
functions that should not be graphed. To disable or “turn off” an equation, move the cursor so
that it is on the equal sign of the graph to turn off and press
ENTER
. The equal sign will not be
highlighted. To enable the function again, move the cursor onto the equal sign and press
ENTER
. The equal sign will be highlighted again, and will show up when graphing.
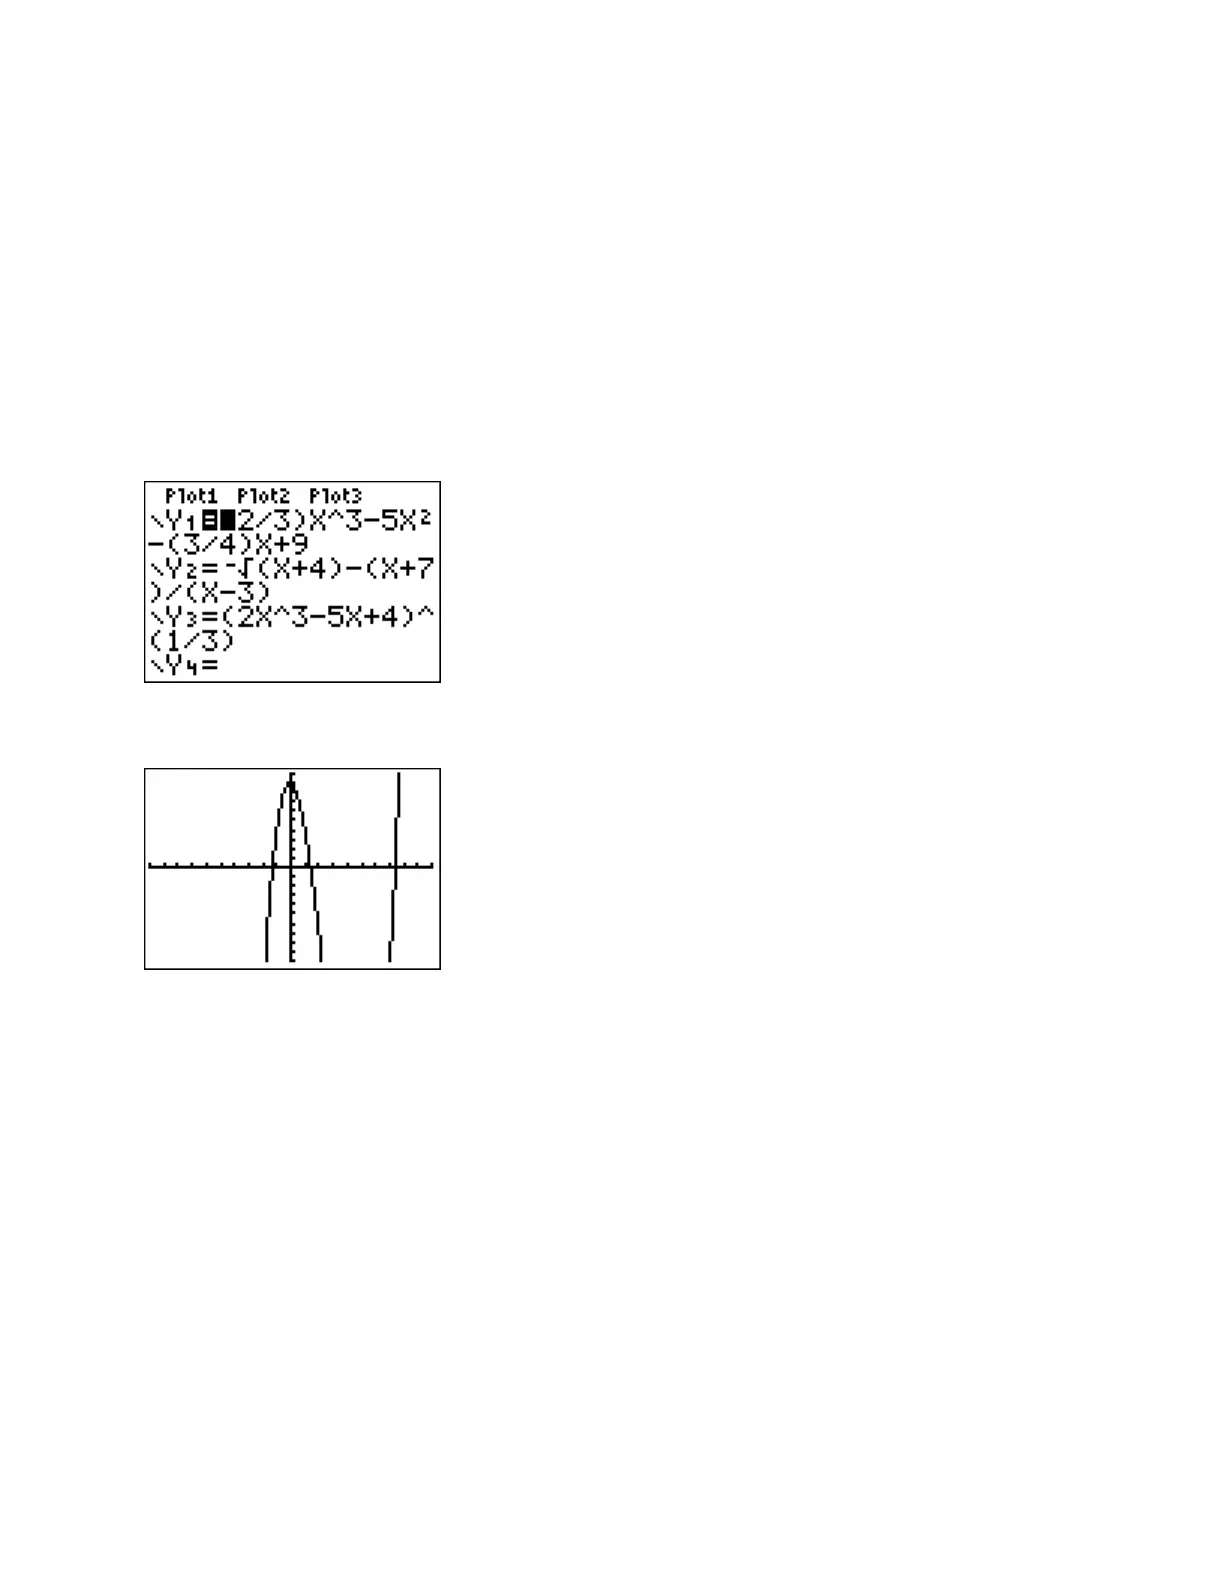
Of the three functions listed on the screen shot below, only Y1 will appear on the graph, since
the other two functions have been disabled.
Press
GRAPH
to view the graph of the function.
Without modification, the calculator will use a standard 10 unit by 10 unit viewing window.
This means that the minimum x value is -10 and the maximum x value is 10, and the minimum y
value is -10 and the maximum y value is 10. This is sometimes written as [-10, 10, -10, 10],
indicating [Xmin, Xmax, Ymin, Ymax].
The graph above shows that the standard viewing window is sometimes not sufficient to view all
of the features of the graph of the function.
In this case, the turning point of the graph in the fourth quadrant is not shown in this viewing
window. To change the viewing window, press
WINDOW
and change the appropriate values.
To revert to the standard viewing window, press
ZOOM, 6
.

 Loading...


