- 20 -
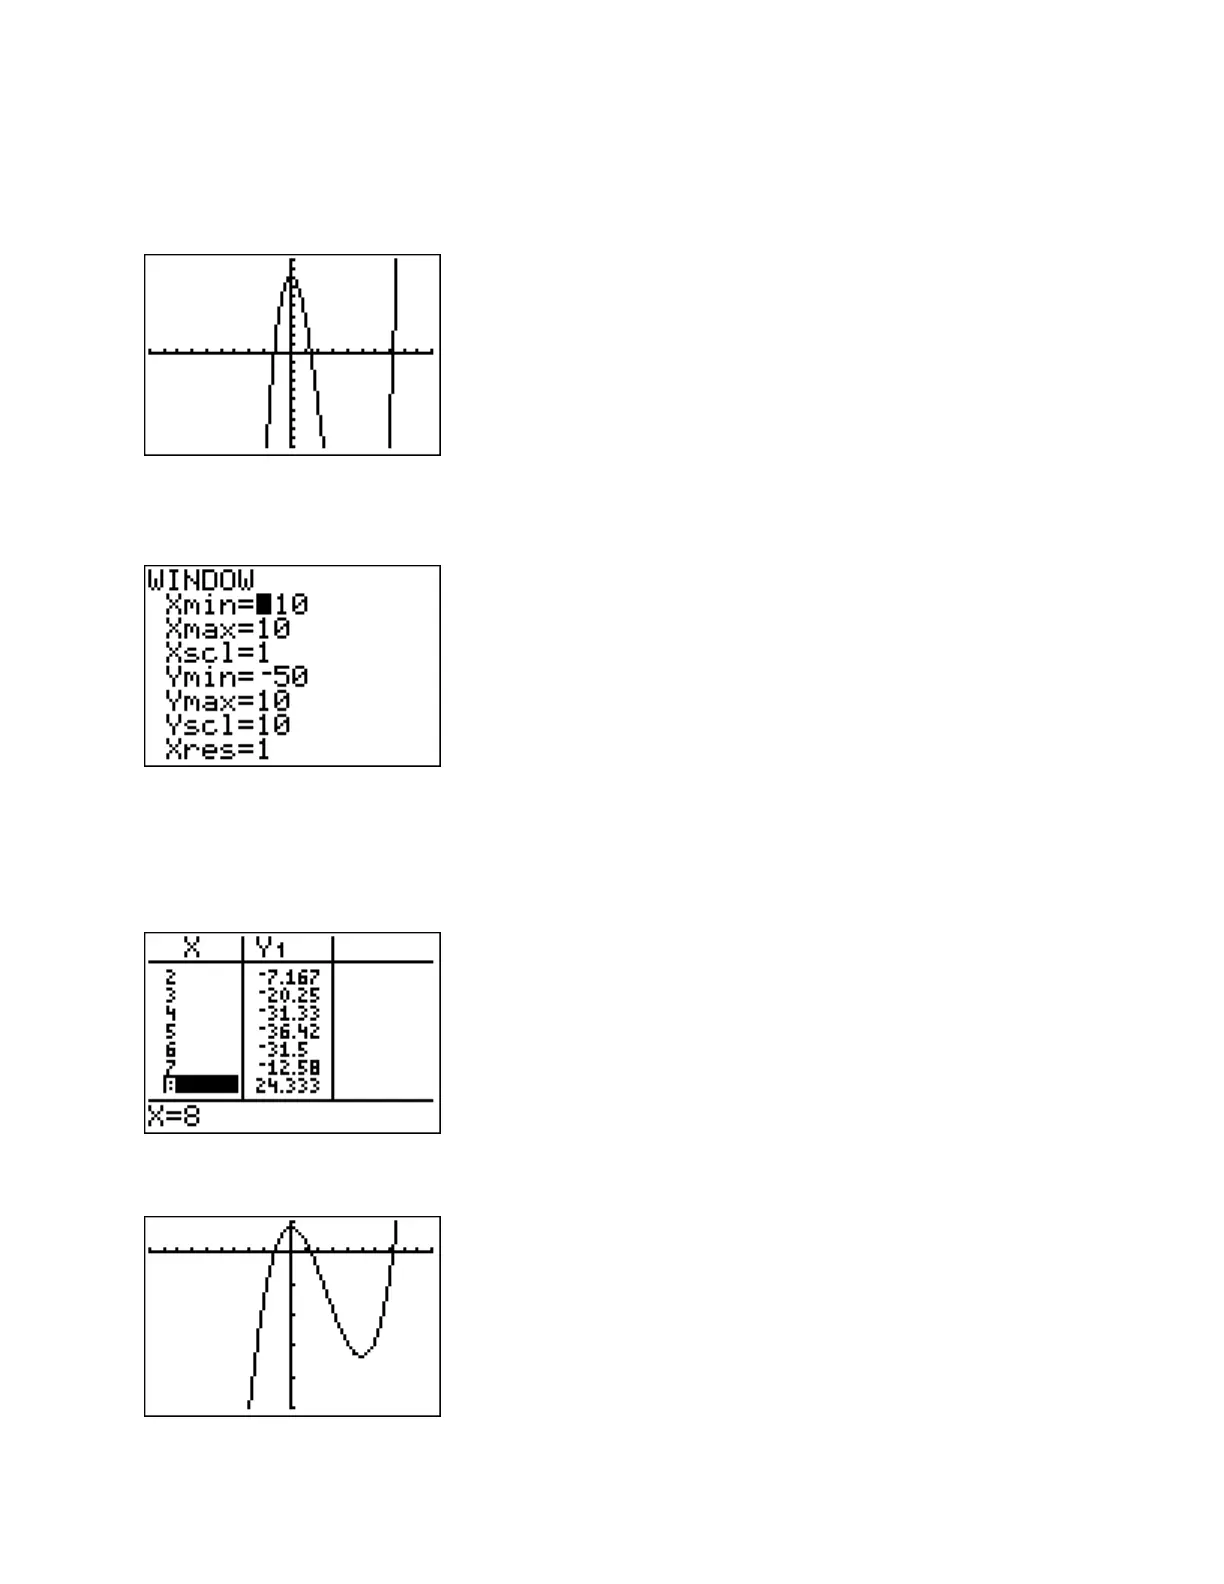
Example: Select an appropriate viewing window for the function graphed in this screen shot.
The graph seems to show enough graph in the x direction, and there seems to be enough graph in
the positive y direction. Change the y minimum to get a better view of the function.
To find an appropriate Ymin value, use trial and error, or scroll down the
TABLE
to see the
smallest y value in the list between x values of 2 and 7. The table below shows a y value of
-36.42, so a Ymin of -50 will display the whole graph and will allow you to see the information
at the bottom of the screen without covering the graph.
Here is the resulting graph of the function.

 Loading...


