- 21 -
The Xscl and Yscl values on
WINDOW
set the scale for each of the axes. These numbers tell
the increment for placing tick marks on the axes. On the graph shown, the Xscl is 1 and the
Yscal is 10, so every mark along the x axis is 1 unit and every mark along the y axis indicates 10
units. With a scale of 0, the graph will display no tick marks.
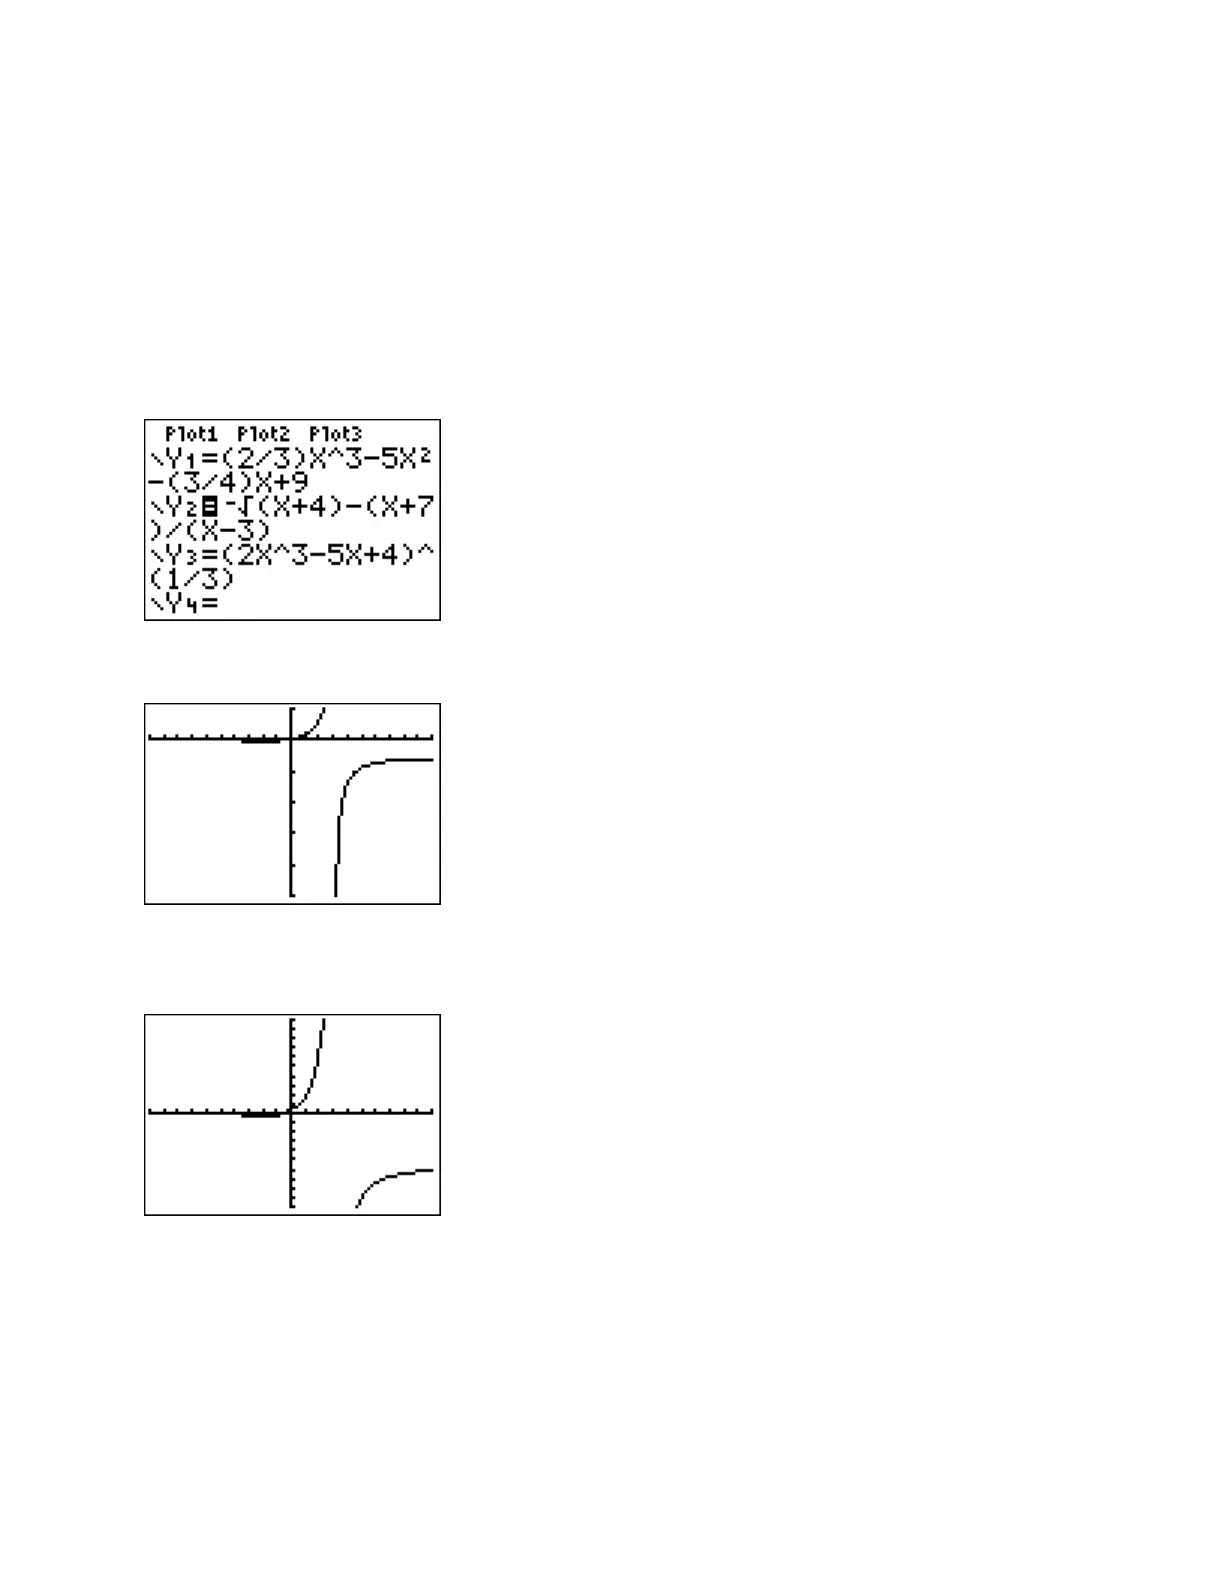
Example: Graph the function entered at Y2.
First, go to
Y=
to turn off Y1 and turn on Y2.
Press
GRAPH
.
The
WINDOW
is still set for the function entered at Y1. To return to the standard viewing
window, press
ZOOM, 6
.
More detail in quadrant 2 is needed, and more of the quadrant 4 portion of the graph should be
displayed. Unfortunately, it may not be possible to get a good view of the entire graph on one
window. Change the viewing window to [-20, 12, -8, 5] and check the result. Change Xscl to 4
and Yscl to 5.

 Loading...


