- 44 -
Using Lists and Scatter Plots
Using Lists and Scatter PlotsUsing Lists and Scatter Plots
Using Lists and Scatter Plots
Clear any existing lists by pressing
STAT, 4, 2
nd
Y, (comma), 2
nd
Z, ENTER.
Press
STAT
,
EDIT
. Put the cursor in the L1 column. Enter the x coordinates of the data. Put the cursor at
the top of the L2 column. Enter the y coordinates of the data. There must be the same number
of entries in both columns.
Example: Enter this information in
LISTS
. Then use
STAT PLOT
to graph.
x
1
2
4
6
8
9
y
5
3
7
5
9
11
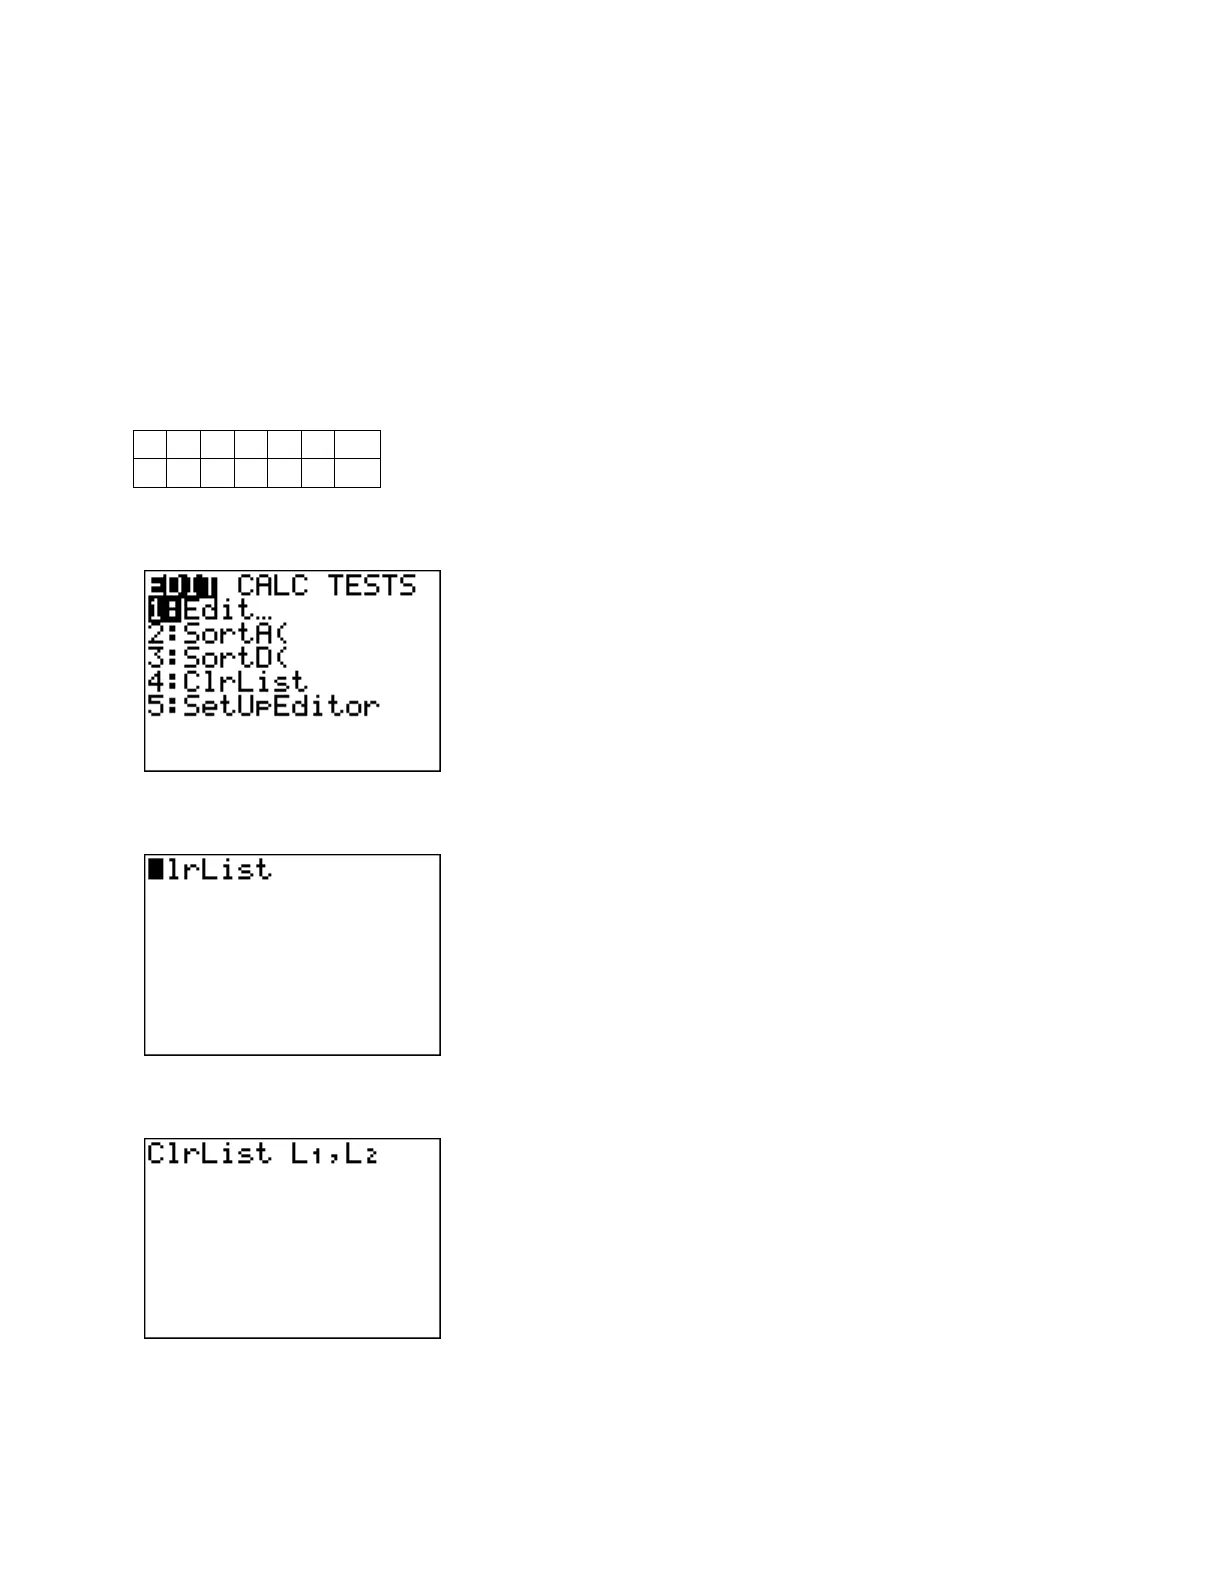
Start by clearing out any existing lists. Press
STAT, 4, 2
nd
1, (comma), 2
nd
2, ENTER.
Press
STAT
and select
4.
Now state which lists to delete.
Press
ENTER
.

 Loading...


