- 45 -
Then press
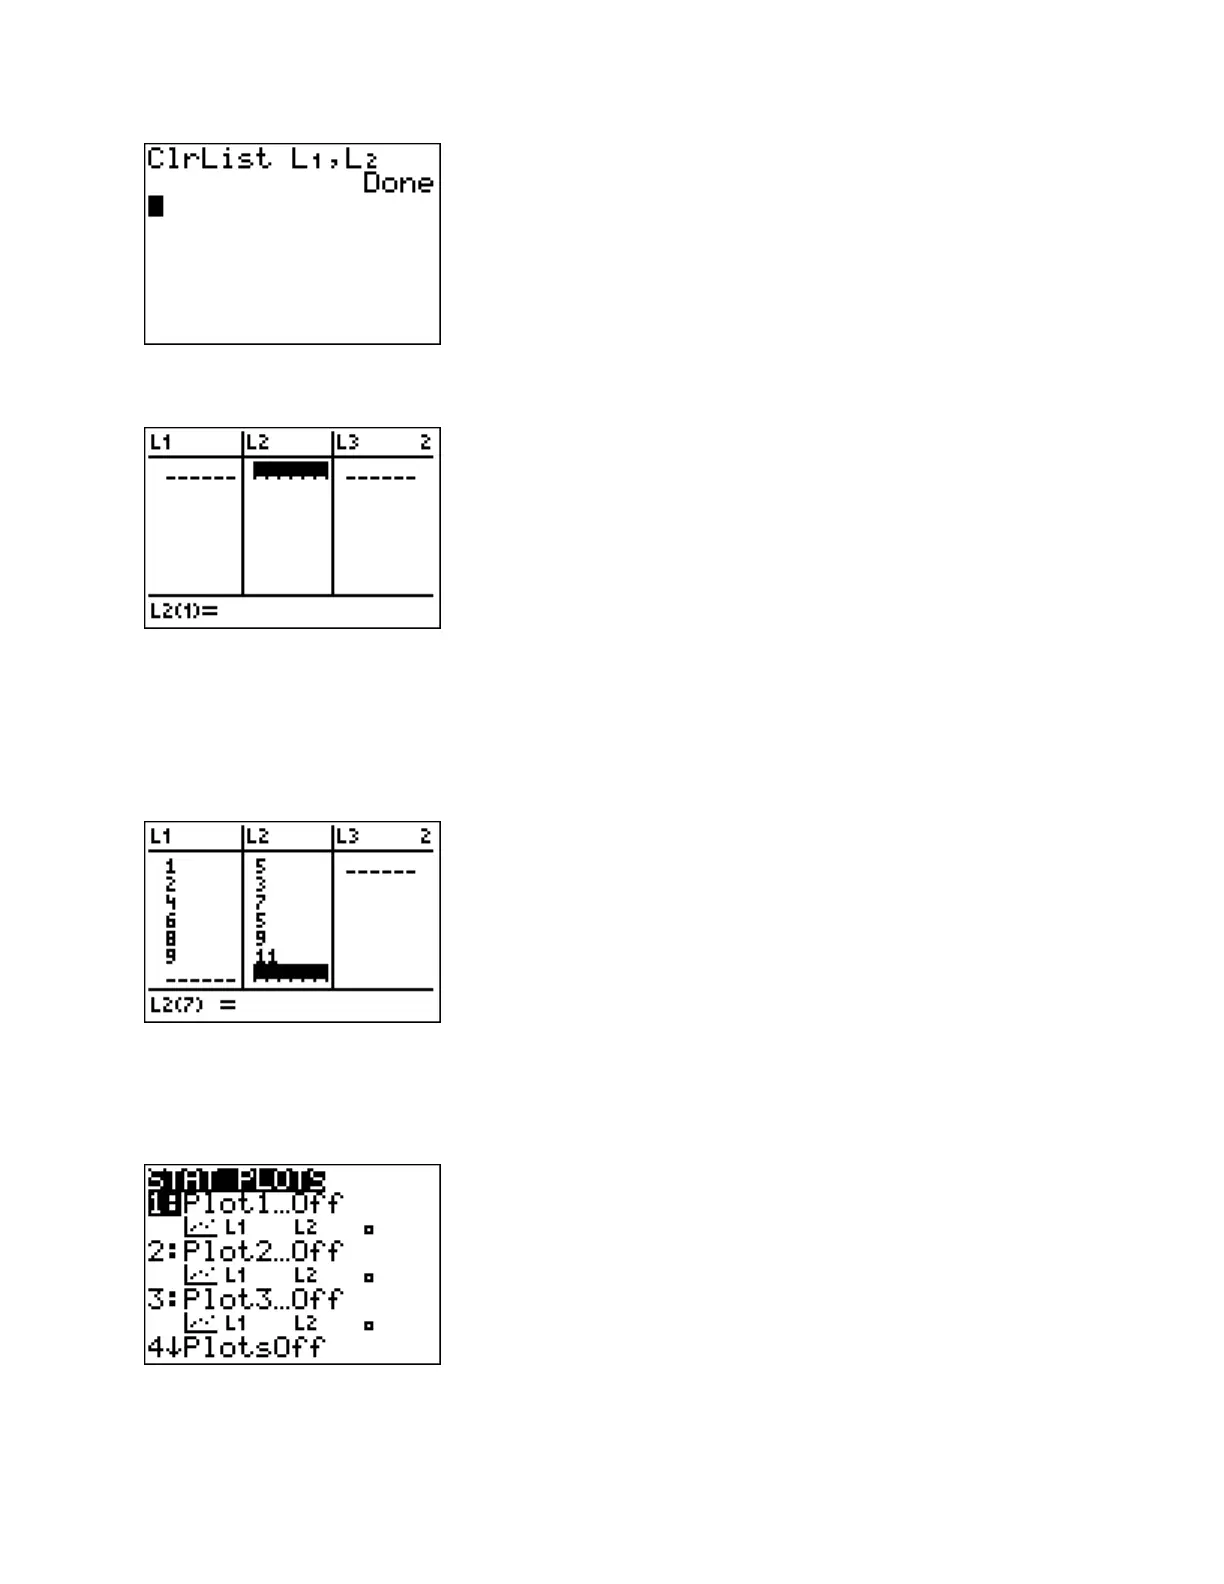
STAT EDIT.
The lists are now empty.
Put the cursor under the heading L1. Enter the x values from the table of values by typing
1,
ENTER, 2, ENTER, 4, ENTER, 6, ENTER, 8, ENTER, 9, ENTER.
Now move the cursor so
that it is under the heading L2. Enter the y values from the table of values.
Before graphing, verify that there are the same number of entries in L1 and L2.
Ordered pairs are graphed using
STAT PLOT.
To access this, press
2
nd
Y=.

 Loading...


