- 53 -
Graphing the Derivative of a Function
Graphing the Derivative of a FunctionGraphing the Derivative of a Function
Graphing the Derivative of a Function
To view the graph of the derivative of a function, enter the function on the
Y=
menu. Then
move to an empty line of the
Y=
menu and enter this string of commands
MATH, 8, 2
nd
VARS,
Y-VARS, Funtion, Y1, (comma) X, (comma) X).
To display the graphs of both the function and the derivative, enable both on the
Y=
menu and
press
GRAPH
. To display only the derivative, make sure it is the only function enabled on the
Y=
menu.
Example: Display the graphs of both
3 2
2 3
f x x x x
and its derivative.
Enter the function at
Y=
. Enter
Math, 8, VARS, y-VARS, Function, (comma) X, (comma), X)
on an empty line of the
Y=
menu. Make sure both lines are enabled and any other entries in
Y=
are disabled. Then press
GRAPH
.
Adjust the viewing window to see them better, if needed.
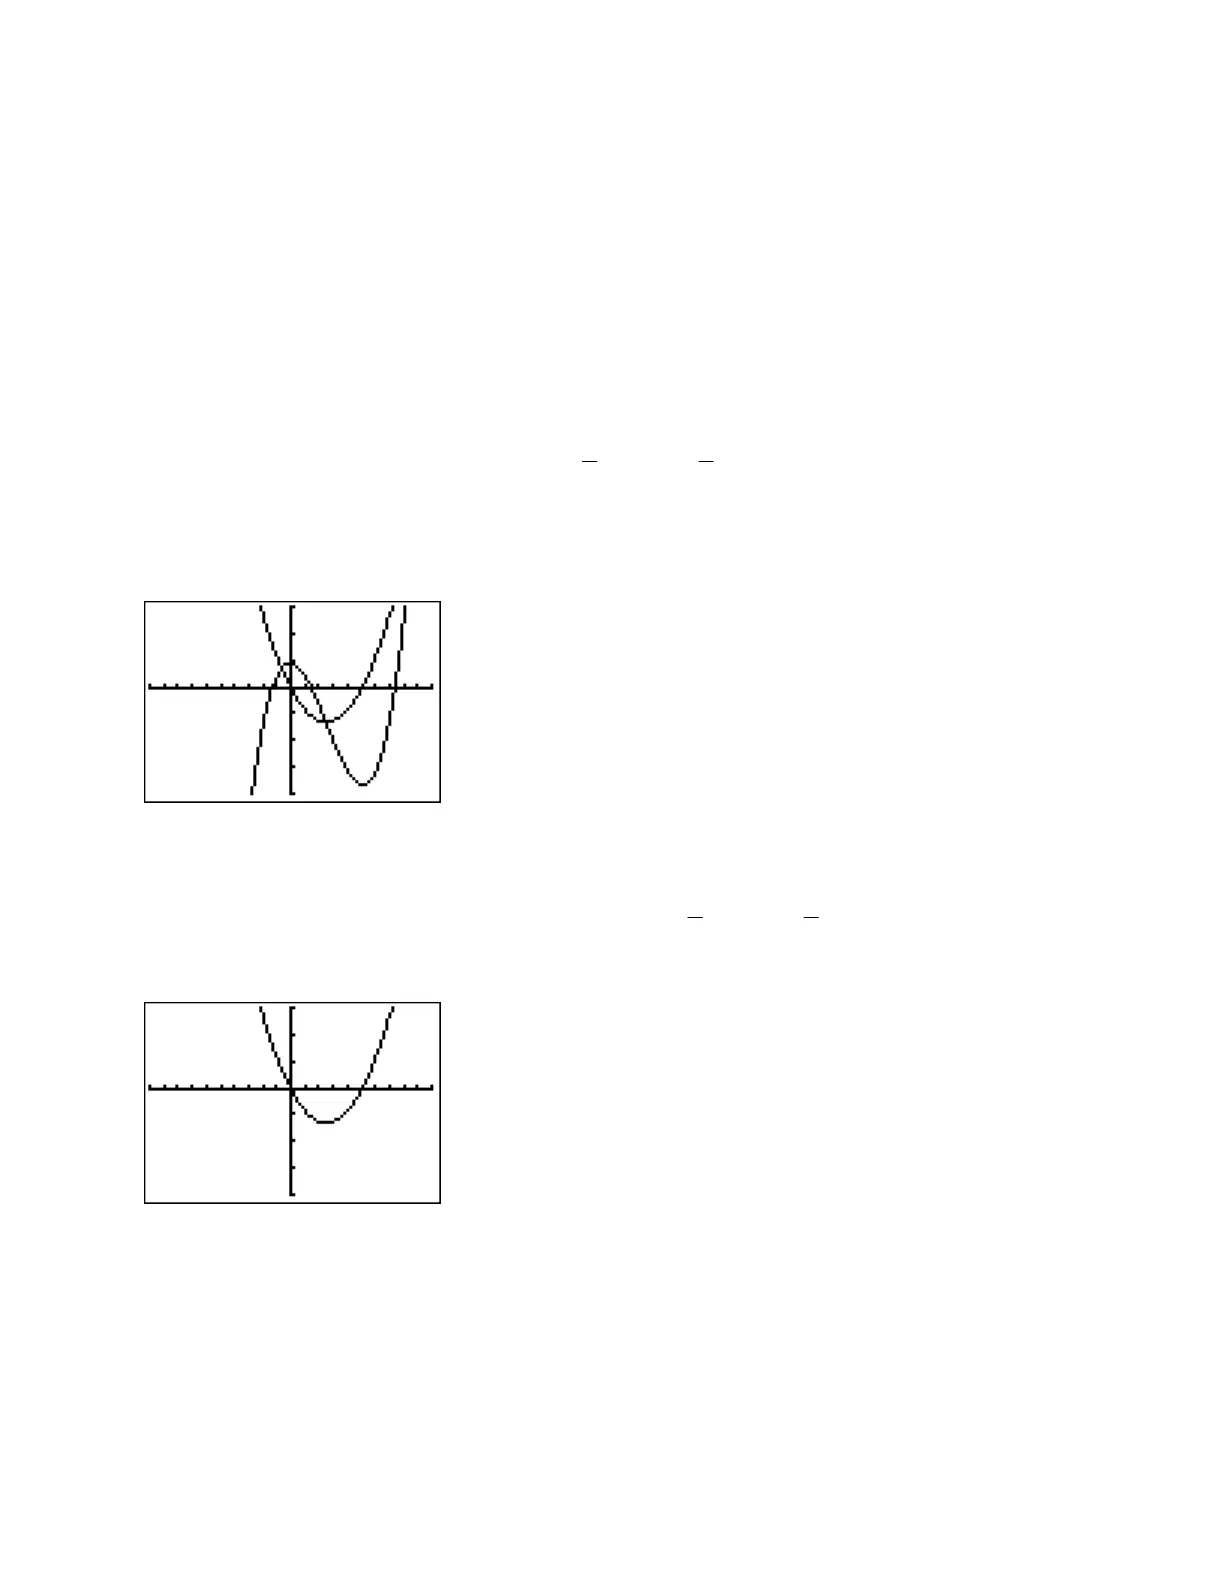
Example: Display the graph of the derivative of
3 2
2 3
f x x x x
Using the display from the previous example, disable
Y1
on the Y= screen and press
GRAPH
.

 Loading...


