TI-89 Guide
TI89-19
Copyright © Houghton Mifflin Company. All rights reserved.
CAUTI ON: If you do not see a third graph, as is the case in the graph in the last picture, you
may have computed the formula correctly. However, you might have an incorrect inverse
function formula whose graph does not show in the current viewing window. We suggest that if
you do not see a third graph that you turn off the graphing location where you have entered your
inverse function formula − here
y2
. (Remember that you turn off a function by having the check
mark to the left of the name not showing.) Then, on the home screen, press
ENTER
to redraw
the inverse function graph and visually check that it is the same graph as the one for
y2
.
Realize
that these methods provide only a visual check on your answer and are not exact.
The answers to parts b and c of Example 4 are found using the
distance (inverse) function in
y2
and the fare (original) function
in
y1
, respectively.
Don’t forget to include units of measure with the answers.
1.3.7 COMPOSITIONPROPERTYOFINVERSEFUNCTIONS
This concept, involved in
part d of Example 4, provides another check on your answer for the inverse function.
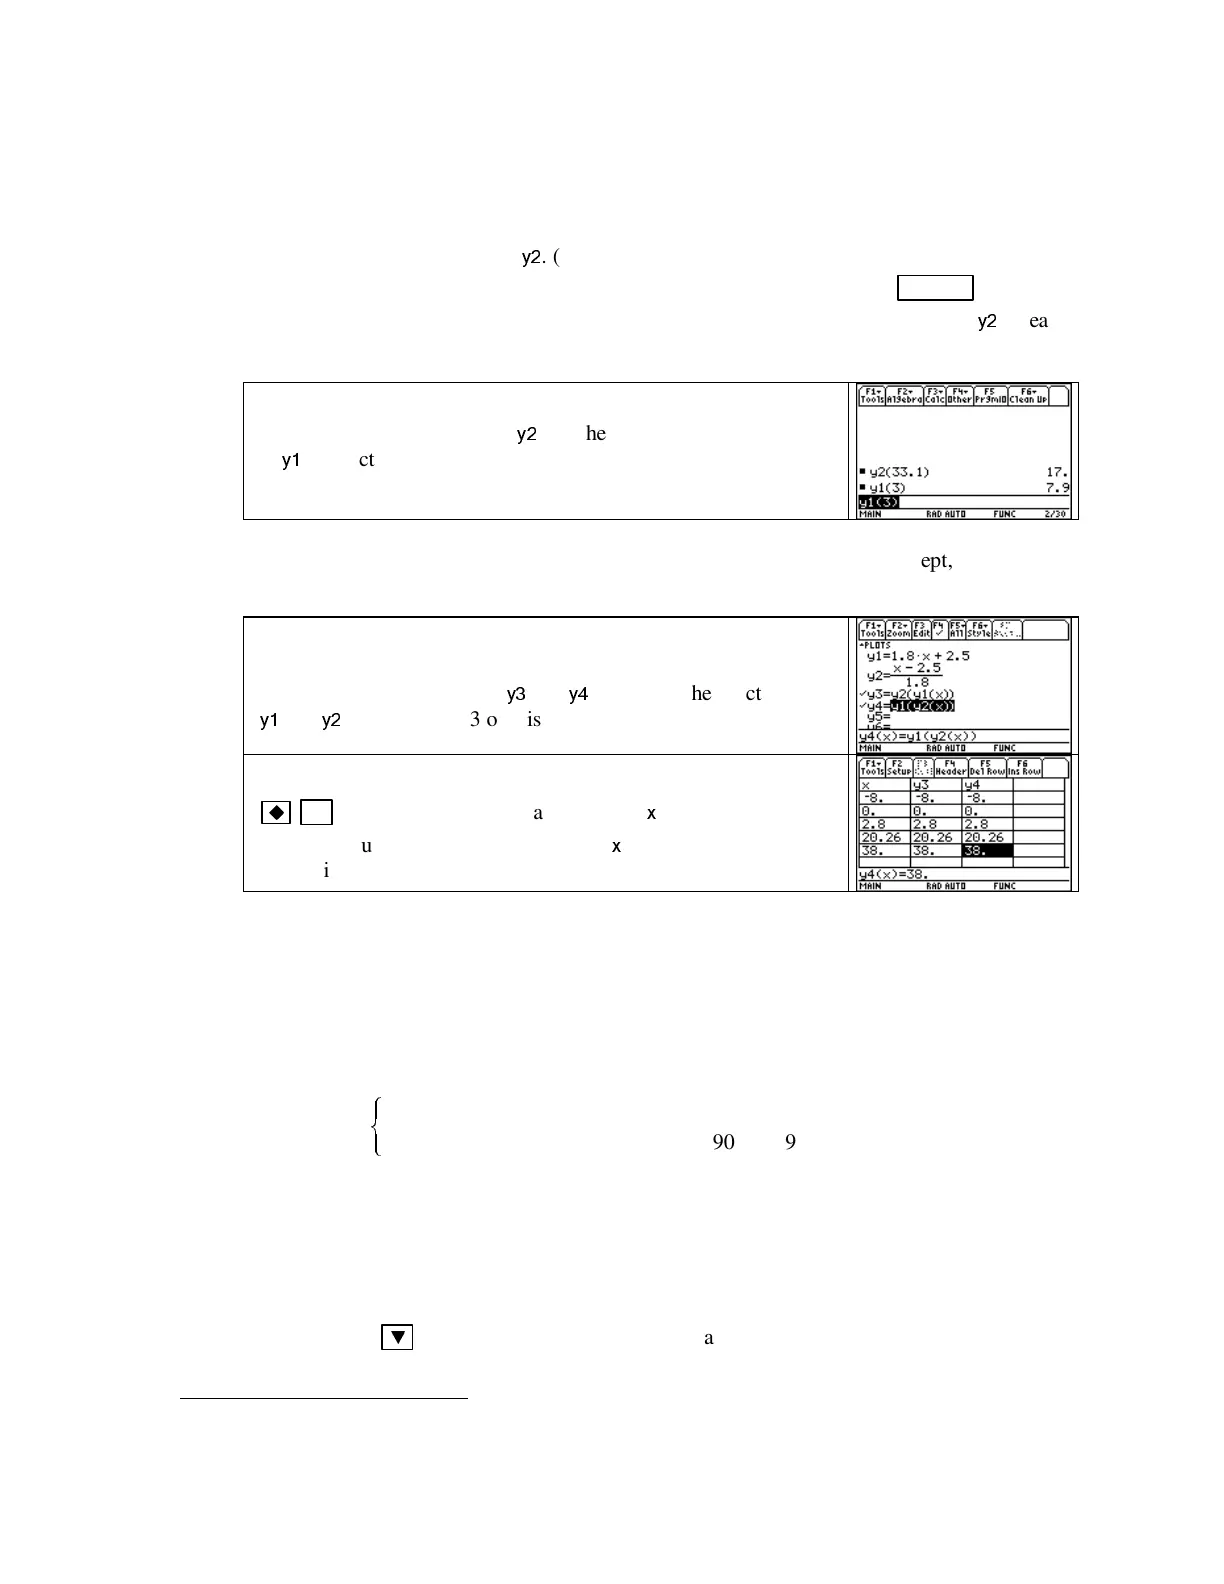
Form the compositions of the inverse function and the original
function according to the Composition Property of Inverse
Functions and enter them in
y3
and
y4
. Turn off the functions in
y1
and
y2
. (Section 1.3.3 of this Guide.)
Have the
TABLE
set to
ASK
mode (See Section 1.1.6) and press
F5 (TABLE).
Enter several values for
x
to see if both
composite functions return that value of
x
. If so, your answer
for the inverse function is very likely correct.
1.3.8 GRAPHING A PIECEWI SE CONTI NUOUS FUNCTION Piecewise continuous func-
tions are used throughout the text. You will need to use your calculator to graph and evaluate
outputs of piecewise continuous functions. Several methods
3
canbeusedtodrawthegraphofa
piecewise function. One of these is presented below using the function that appears in Example
6ofSection1.3inCalculus Concepts:
The population of West Virginia from 1985 through 1993 can be modeled by
Pt
tt
tt
()
thousand people when
thousand people when
=
−
+≤<
+≤≤
R
S
T
23514 3903667 85 90
7 7 1098 7 90 93
..
..
where t is the number of years since 1900.
The TI-89 syntax for drawing a piecewise function consisting of two pieces is
when(condition, true expression, false expression)
The TI-89
CATALOG
contains all the TI-89 commands. If you press the first letter of the word
you are trying to find in the catalog, it automatically scrolls to the first word that begins with that
letter. Then use
▼
to find what you are looking for and enter it in what you are typing.
3
Instructions for drawing a piecewise function consisting of three pieces and more than three pieces are given on pages
194-195 of the TI-89 Guidebook.
 Loading...


