TI89-20
Chapt er 1
Copyright © Houghton Mifflin Company. All rights reserved.
Be on the home screen and press
CATALOG .
Because when
begins with w,press
. (W). ENTER
copies the instruction to
the entry line. Also notice that the general syntax for each
instruction is printed at the bottom of the screen in the catalog.
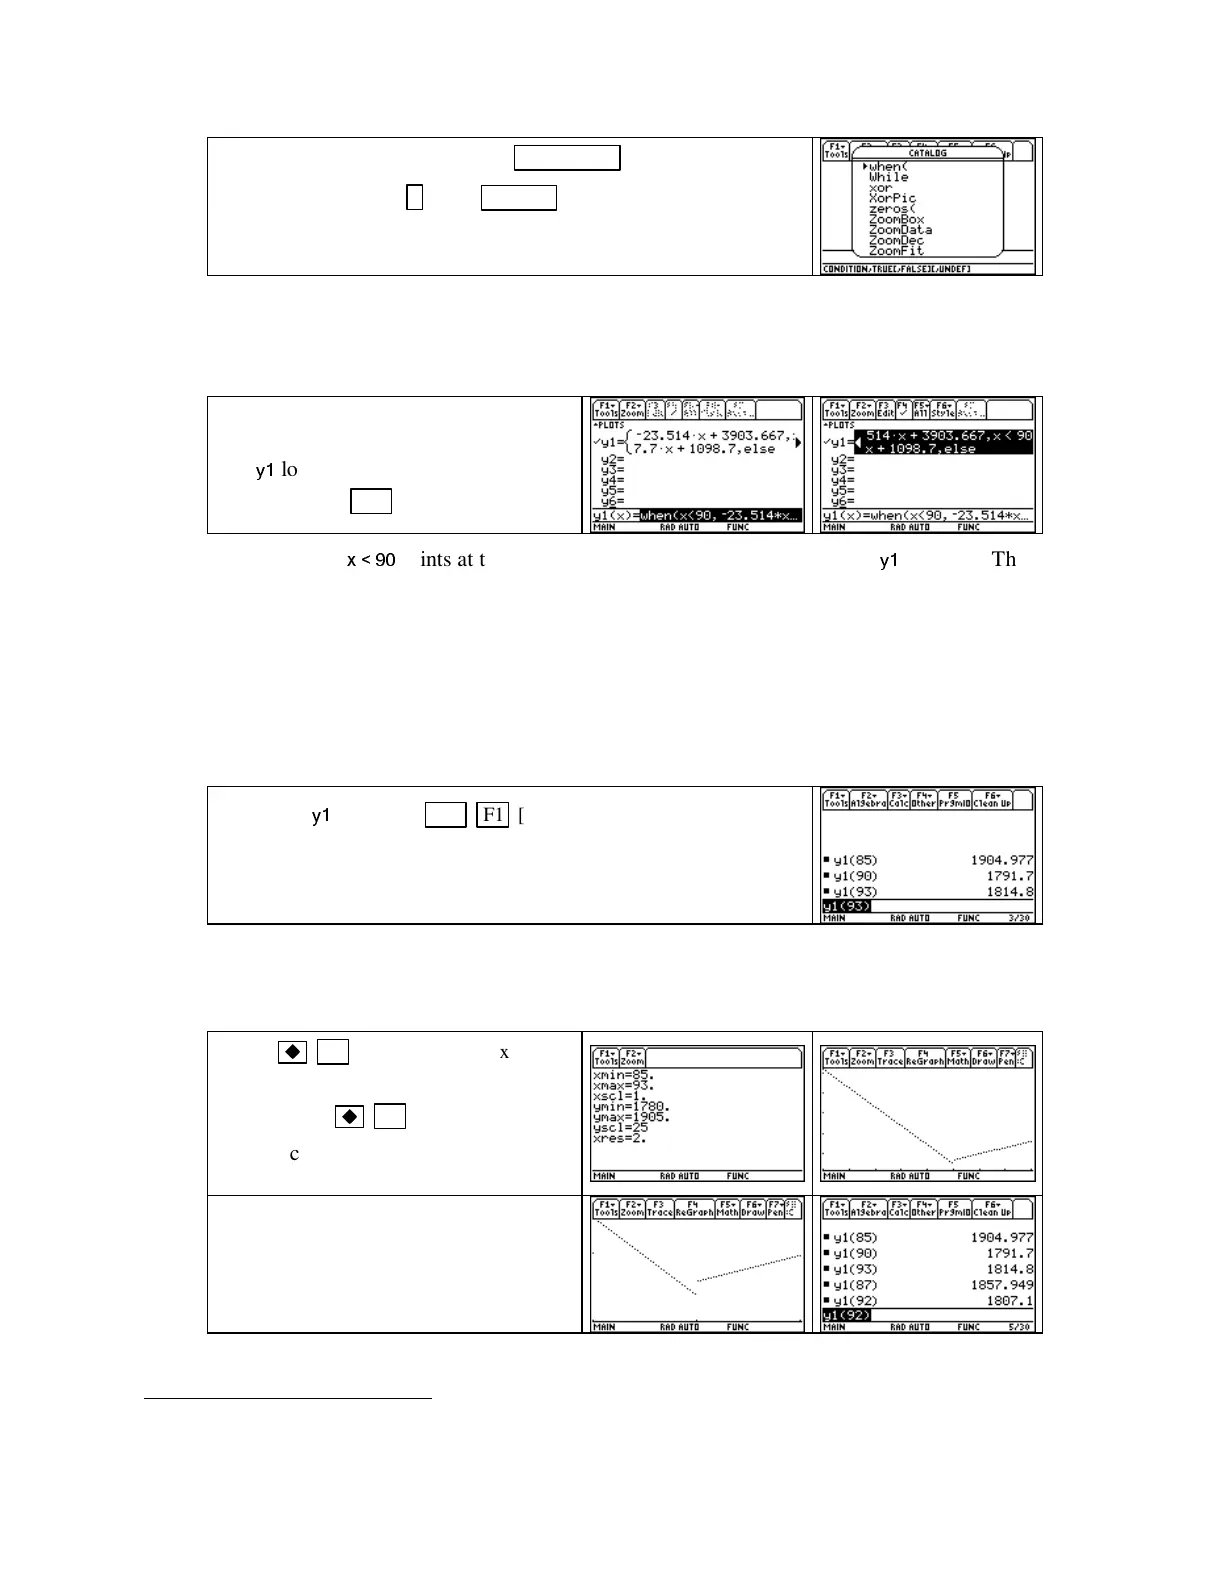
We intend to graph the population function P, so we need to enter it in the
Y=
list with x as the
input variable. Because the break point is at x = 90, the piecewise function syntax becomes
when(x < 90,
−
23.514x + 3903.667, 7.7x + 1098.7)
Clear any functions that are in the
Y=
list. Type the above when statement in
the
y1
location. The < symbol is
accessed with
2nd 0(<).
•
Note that
x < 90
prints at the end of the first piece of the function in the
y1
position. The
word else that appears with the second piece means that this part of the function should
be used everywhere else; that is, when x ≥ 90.
Your calculator draws graphs by connecting function outputs wherever the function is defined.
However, this piecewise function breaks at x = 90. The TI-89 will connect the two pieces of P
unless you tell it not to do. Whenever you draw graphs of piecewise functions, you should set
yourcalculatorto
Dot
mode as described below so that it will not connect the different pieces of
the function. (When a particular style is chosen, a check mark appears by it in the style list.)
Highlight
y1
and press
2nd F1 [F6: Style
4
]2[Dot].
Next, set the window. The function P is defined only when the
input is between 85 and 93. So, on the home screen we evaluate
P(85), P(93), and P(90) to help when setting the vertical view.
NOTE: Instead of finding the outputs as shown above, you can set the window with
ZoomFit
as
described in Section 1.1.2 of this Guide. If you do this, reset
ymin
to a smaller value so that
you can better view the break point.
Press
F2 (WINDOW),
set
xmin =
85, xmax = 93, ymin ≈ 1780,
and
ymax ≈
1905.
Press
F3 (GRAPH).
Take a closer look at the break point
with the window given below.
Set
xmin = 89, xmax = 91, ymin = 1780,
and
ymax = 1810.
Usetheentrylineon
the home screen to evaluate the other
outputs needed in this example.
4
The different graph styles you can draw from this location are described in more detail on page 100 in your TI-89
Guidebook.
 Loading...


