TI89-22
Chapt er 1
Copyright © Houghton Mifflin Company. All rights reserved.
value to one more decimal place (here, to 4 decimal places) for three consecutive outputs. Then, round
that common value off to the requested 3 places for the desired limit. Your instructor may establish a
different rule from this one, so be sure to ask.
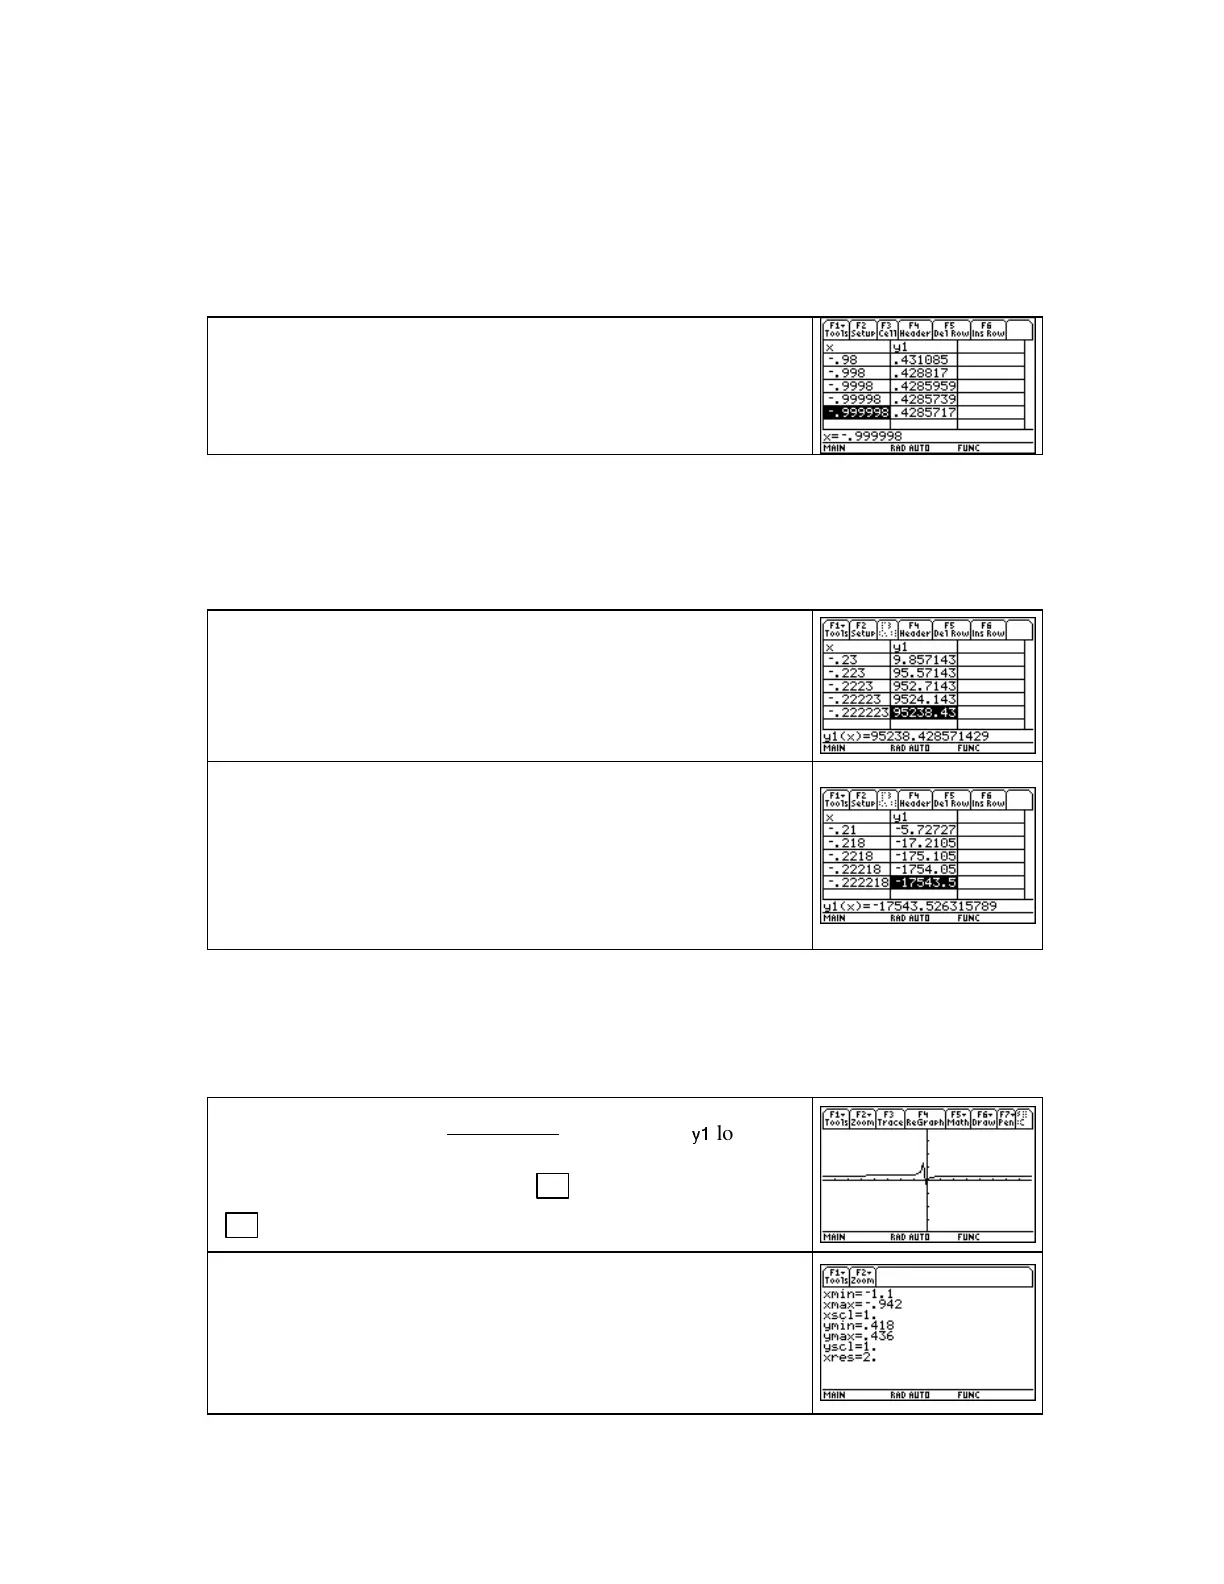
Using this Rule of Thumb and the results that are shown on the last calculator screen, we estimate that
lim
x→
−
1
−
u(x) = 0.429. We now need to estimate the limit from the right of
−
−−
−
1.
Delete the values currently in the table
.
To numerically estimate
lim
x→
−
1
+
u(x), enter values to the right of, and becoming closer and
closer to,
−
1. (Note: Again, the values that you enter do not
have to be those shown in the text or these shown to the right.)
Because the output 0.4285… appears three times in a row, we estimate that
lim
x→
−
1
+
u(x)=
0.429. Then, because
lim
x→
−
1
−
u(x)=
lim
x→
−
1
+
u(x) = 0.429, we estimate that
lim
x→
−
1
u(x) = 0.429.
We now illustrate finding the limit in part b of Example 2 in Section 1.4 of Calculus Concepts:
Delete the values currently in the table
.
To numerically estimate
lim
x→
−
2/9
−
u(x), enter values to the left of, and becoming closer and
closer to,
−
2/9 =
−
0.222222…. Because the output values appear
to become larger and larger, we estimate that
lim
x→
−
2/9
−
u(x) →∞.
Delete the values currently in the table
.
To numerically estimate
lim
x→
−
2/9
+
u(x), enter values to the right of, and becoming closer
and closer to,
−
2/9. Because the output values appear to become
larger and larger, we estimate that
lim
x→
−
2/9
−
u(x) →
−
∞.Thus,
lim
x→
−
2/9
u(x) does not exist.
1.4.2 CONFI RMING LI MITS GRAPHICALLY – ZOOMING IN AND OUT A graph can
be used to confirm a limit that you estimated numerically. You also can zoom in or zoom out
on the graph to obtain a better view of the limit you are estimating. We again illustrate using
the function u that appears in Example 2 of Section 1.4 in Calculus Concepts.
Have the function u(x)=
33
9112
2
2
xx
xx
+
++
enteredinthe
y1
location
of the
Y=
list. A graph drawn with
F2 [Zoom] 4 [ZoomDec]
or
F2 [Zoom] 6 [ZoomStd]
is not very helpful.
To confirm that
lim
x→
−
1
u(x) = 0.429, we are only interested in
values of u that are near
−
1. So, choose values very near to
−
1
for the x-view and evaluate the function at those x-values to help
determine the y-view. We manually set the window to values
such as those shown to the right and draw the graph.

 Loading...


