TI-89 Guide
TI89-23
Copyright © Houghton Mifflin Company. All rights reserved.
If you look closely, you can actually see the “hole” in the graph
at x =
−
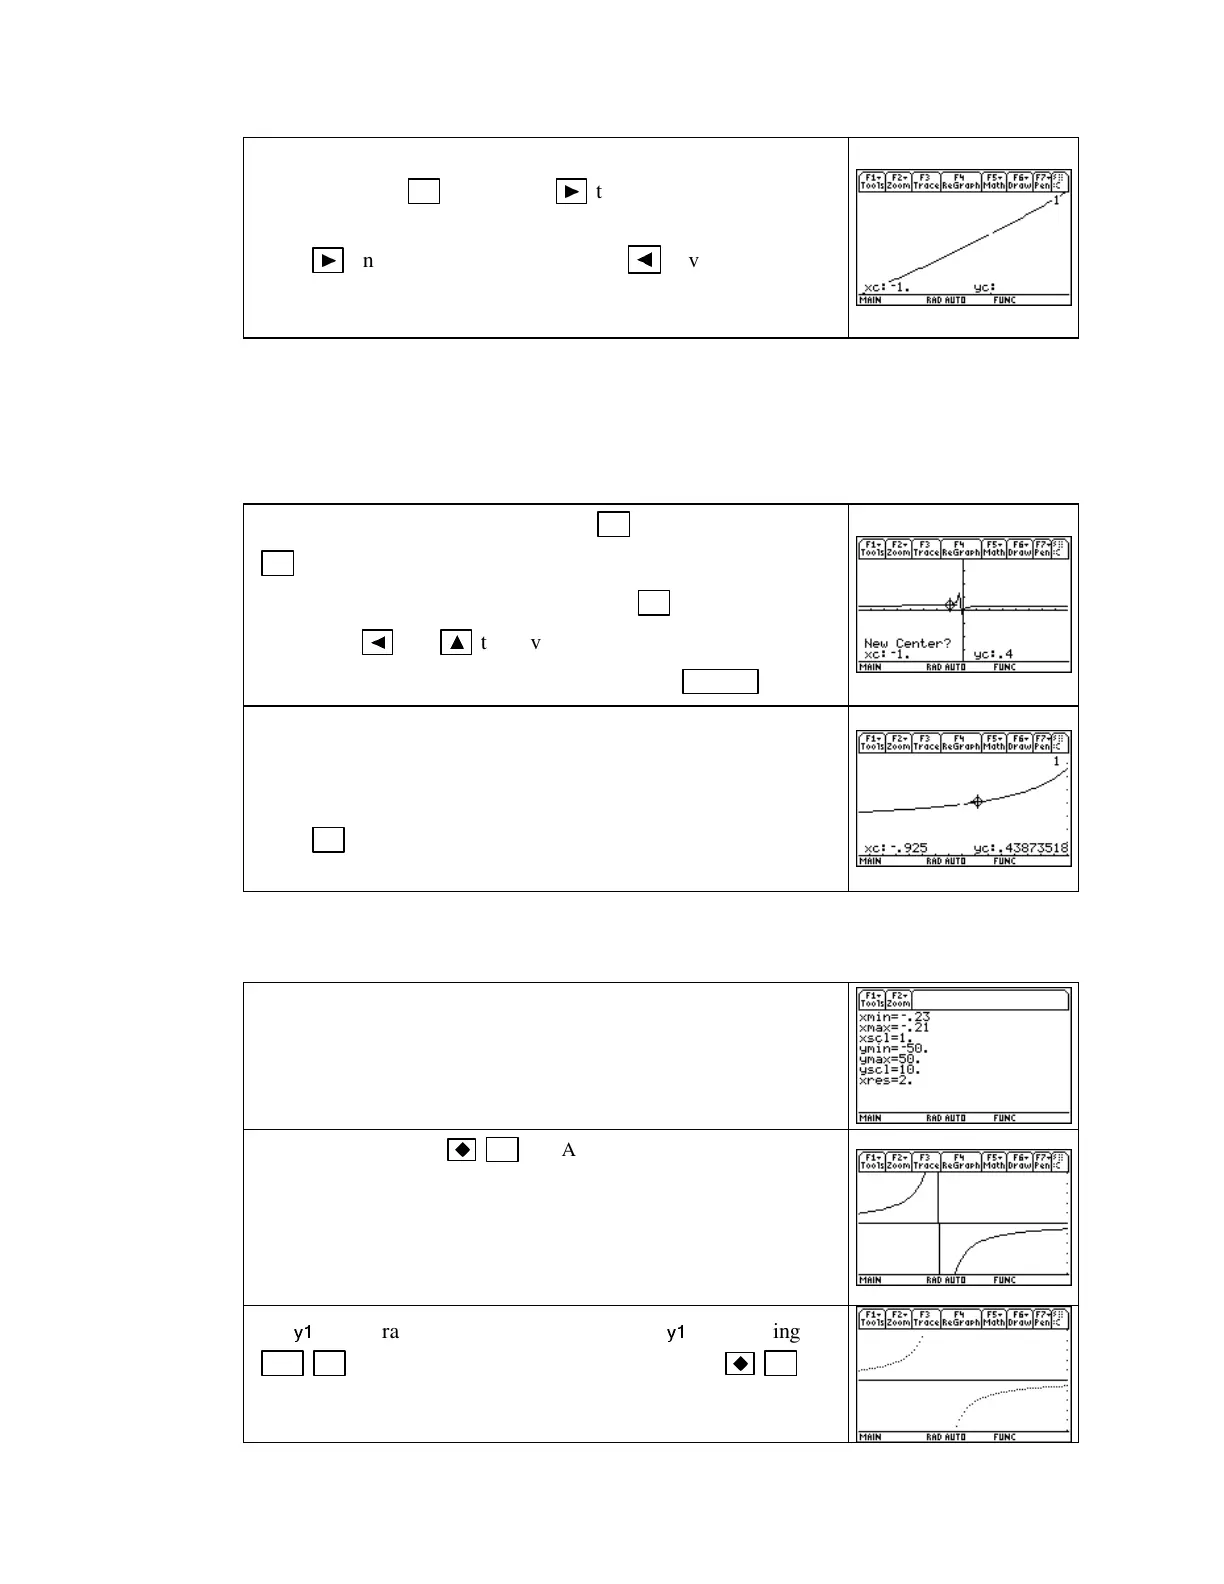
1. Press
F3 [Trace]
,use
►
to trace to where x =
−
1,
and the TI-89 confirms that u is not defined at x =
−
1. Now
press
►
and observe the y-value. Press
◄
several times to
go to the left of x =
−
1 and confirm from the y-values that the
limit is approximately what we had determined numerically.
Note that we confirmed that the limit exists by seeing that the two parts of the graph (to the left
and right of x =
−
1) move toward the same point. Tracing around x =
−
1 provides a check on the
numerical value of the limit.
The previous instructions show how to zoom in by manually setting the window. You can
also zoom in with the zoom menu of the calculator. We next describe this method.
Return to the graphing screen set with
F2 [Zoom] 4 [ZoomDec]
or
F2 [Zoom] 6 [ZoomStd]
or any screen where you can see the
portion of the graph around x =
−
1.) Press
F2 [Zoom] 2 [Zoom
In]
and use
◄
and
▲
to move the blinking cursor until you are
near the point on the graph where x =
−
1. Press
ENTER .
Depending on the horizontal view, you may or may not be able
to see the hole in the graph at x =
−
1. If your view is not magni-
fied enough to see what is happening around x =
−
1, repeat the
zoom-in process. To check your numerical estimate of the limit,
press
F3 [Trace]
, use the arrow keys to move to either side of x
=
−
1, and observe the y-values.
Now let’s consider the limit in part b of Example 2 of Section 1.4. We want to confirm with a
graph what was found numerically; that is, we wish to confirm that
lim
x→
−
2/9
u(x) does not exist.
We want to zoom out on the graph to confirm that the limit of
u(x)asxapproaches
−
2/9 does not exist. To do this, we set a
small x-view and a larger y-view. (Note that these values are
arbitrary – any small x-view that includes
−
2/9 and any y-view in
which the graph can be seen clearly will do.)
Draw the graph with
F3 (GRAPH).
Before continuing with
the limit investigation, we need to eliminate the “extra” vertical
line that appears on the above graph at x =
−
2/9. The line appears
because we are graphing in
Line
mode, which tells the TI-89 to
connect points on the graph. (You may or may not have the line
on your graph.)
Set
y1
set to draw in
Dot
mode by highlighting
y1
and pressing
2nd F1 [F6: Style] 2 [Dot].
Redraw the graph with
F3
(GRAPH).

 Loading...


