TI89-24
Chapt er 1
Copyright © Houghton Mifflin Company. All rights reserved.
You can zoom out more by resetting
ymin
and
ymax
to larger
values. Then, press
F3 [Trace]
and go left and right on the
graph to confirm that it “splits” near x =
−
2/9 ≈
−
0.222222….
It appears that as x approaches
−
2/9 from the left that the
outputs become larger and larger and that as x approaches
−
2/9
from the right that the outputs become smaller and smaller.
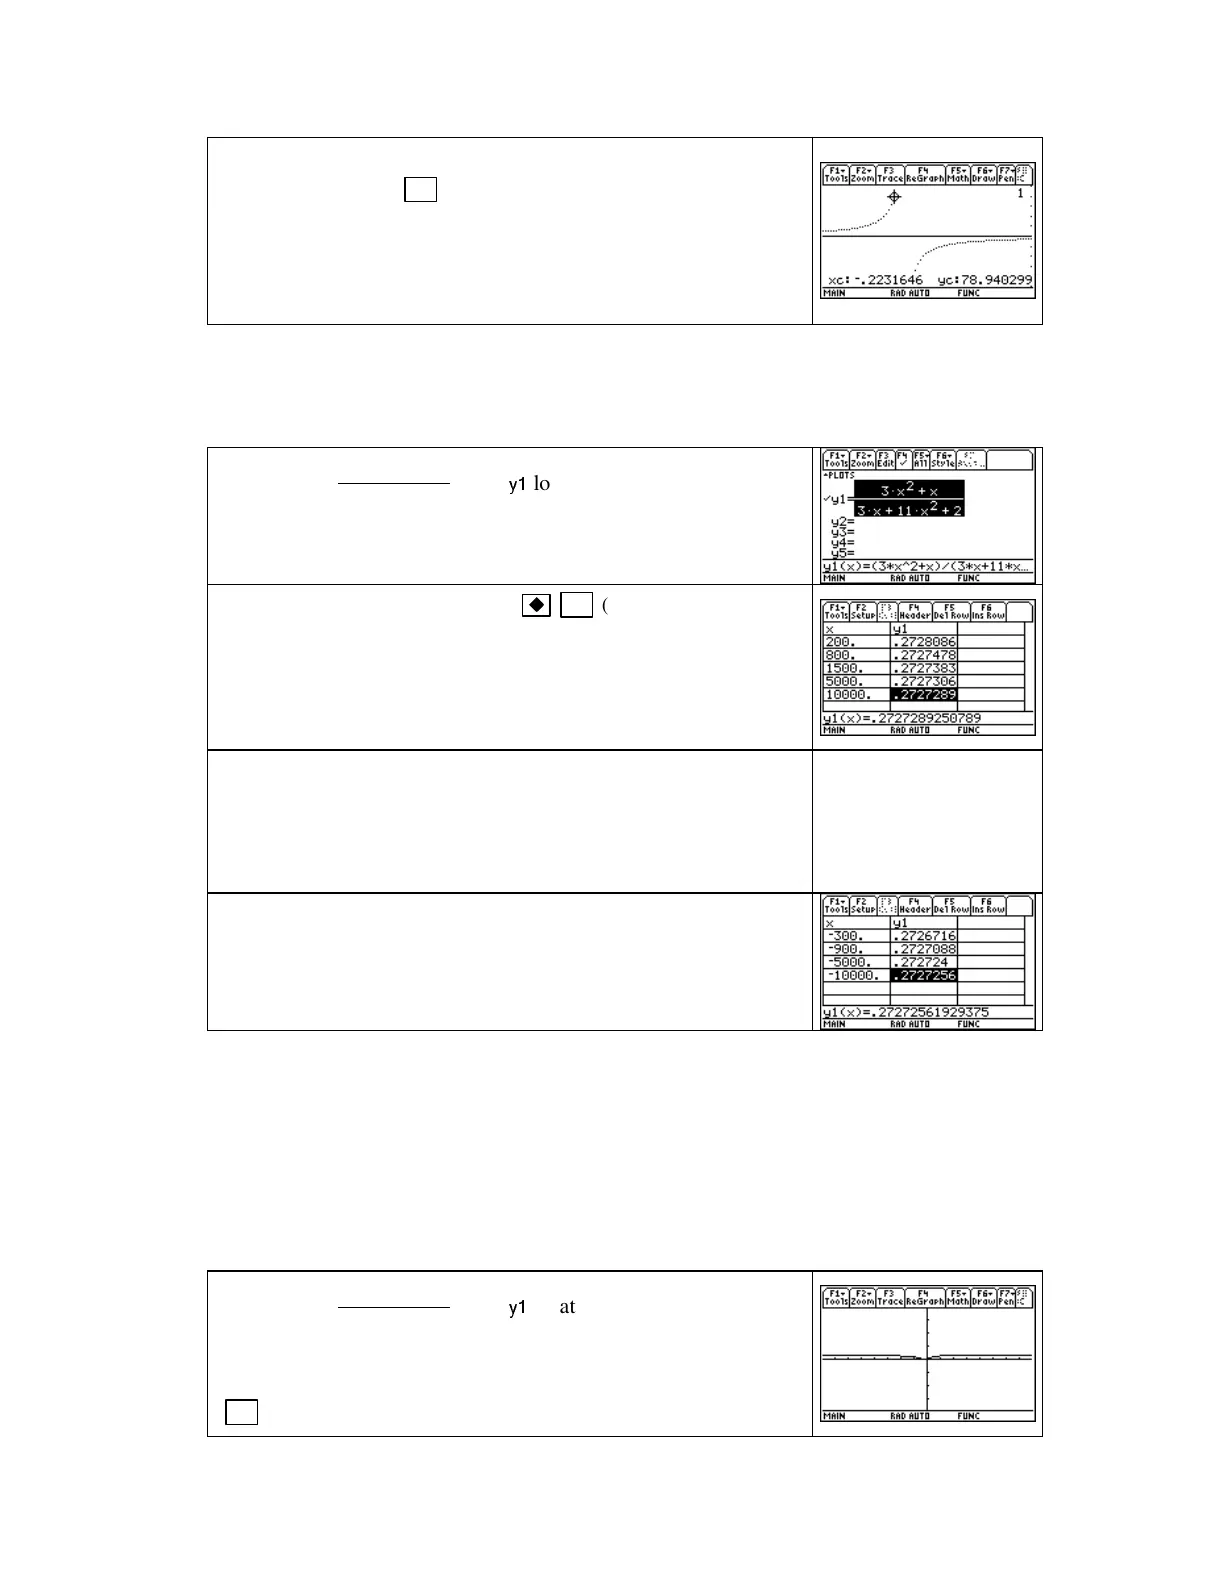
1.4.3 INVESTIGATINGENDBEHAVIORNUMERICALLY Investigating end behavior using
the TI-89 table is very similar to numerically estimating the limit at a point. We illustrate this
using the function that appears in Example 4 of Section 1.4 in Calculus Concepts.
Have u(x)=
3
311 2
2
2
xx
xx
+
++
in the
y1
location of the
Y=
list. Be
certain that you remember to enclose both the numerator and
denominator of the fraction in parentheses.
Have
TblSet
set to
ASK
and press
F5 (TABLE).
Delete any
values that are in the table
.
In order to numerically estimate
lim
x→∞
u(x), enter values of x that get larger and larger. (Note:
The values that you enter do not have to be those shown in the
text or these shown to the right.)
We assume that we want the limit accurate to 3 decimal places.
AccordingtoourRule of Thumb for Determining Limits from
Tables (pageC-21),onceweseethesamevalueto4decimal
positions 3 times in a row, we can estimate the limit by rounding
off the answer to 3 decimal places.
lim
x→∞
u(x) ≈ 0.273
Note that the last entry
in the table (x = 10,000)
was not necessary.
Part b of Example 4 asks for
lim
x→
−
∞
u(x). Delete or type over the
values that are currently in the table
.
Then, enter values of x that
get smaller and smaller. We estimate
lim
x→
−
∞
u(x) ≈ 0.273.
CAUTI ON: It is not the final value, but a sequence of several values, that is important when
determining limits. If you enter a very large or very small value, you may exceed the limits of
the TI-89’s capability and obtain an incorrect number. Always look at the sequence of values
obtained to make sure that all values found make sense.
1.4.4 INVESTIGATINGENDBEHAVIORGRAPHICALLY As was the case with limits at a
point, a graph of the function can be used to confirm a numerically-estimated limit. We again
illustrate with the function that appears in Example 4 of Section 1.4 in Calculus Concepts.
Have u(x)=
3
311 2
2
2
xx
xx
+
++
in the
y1
location of the
Y=
list. (Be
certain that you remember to enclose both the numerator and
denominator of the fraction in parentheses.) A graph drawn with
F2 [Zoom] 4 [ZoomDec]
is a starting point.

 Loading...


