Copyright © Houghton Mifflin Company. All rights reserved.
TI89-6
Chapter 1 I ngredients of Change:
Functions and Linear Models
1.1 Models, Functions, and Graphs
There are many uses for a function that is entered in the calculator. One of the ways we often
use functions is to graph them in an appropriate viewing windows. Because you must enter a
function on one line (that is, you cannot type fractions and exponents the same way you write
them on paper even though the TI-89 displays them in this form after they are entered), it is very
important to have a good understanding of the calculator’s order of operations and to correctly
use parentheses whenever they are needed.
1.1.1 ENTERI NG AN EQUATI ON I N THE GRAPHI NG LI ST The graphing list contains
space for 99 equations, and the output variables are called by the names
y1(x)=
,
y2(x)=
, ...,
and
y99(x)=
.
When you want to graph an equation, first enter in the graphing list. You must use
x
as the input variable if you intend to draw the graph of the equation or use the TI-89 table.
We illustrate graphing with the equation in Example 4 of Section 1.1: v(t) = 3.622(1.093
t
).
Press either
F1 (Y
=
)
or
APPS 2 [Y= Editor]
to access the
graphing list. If there are any previously entered equations that
you will no longer use, delete them from the graphing list. For
convenience, we use the first, or
y1
, location in the graphing list.
To delete an equation from
the Y
=
list, position the
cursor on the line with the
equation. Press CLEAR
.
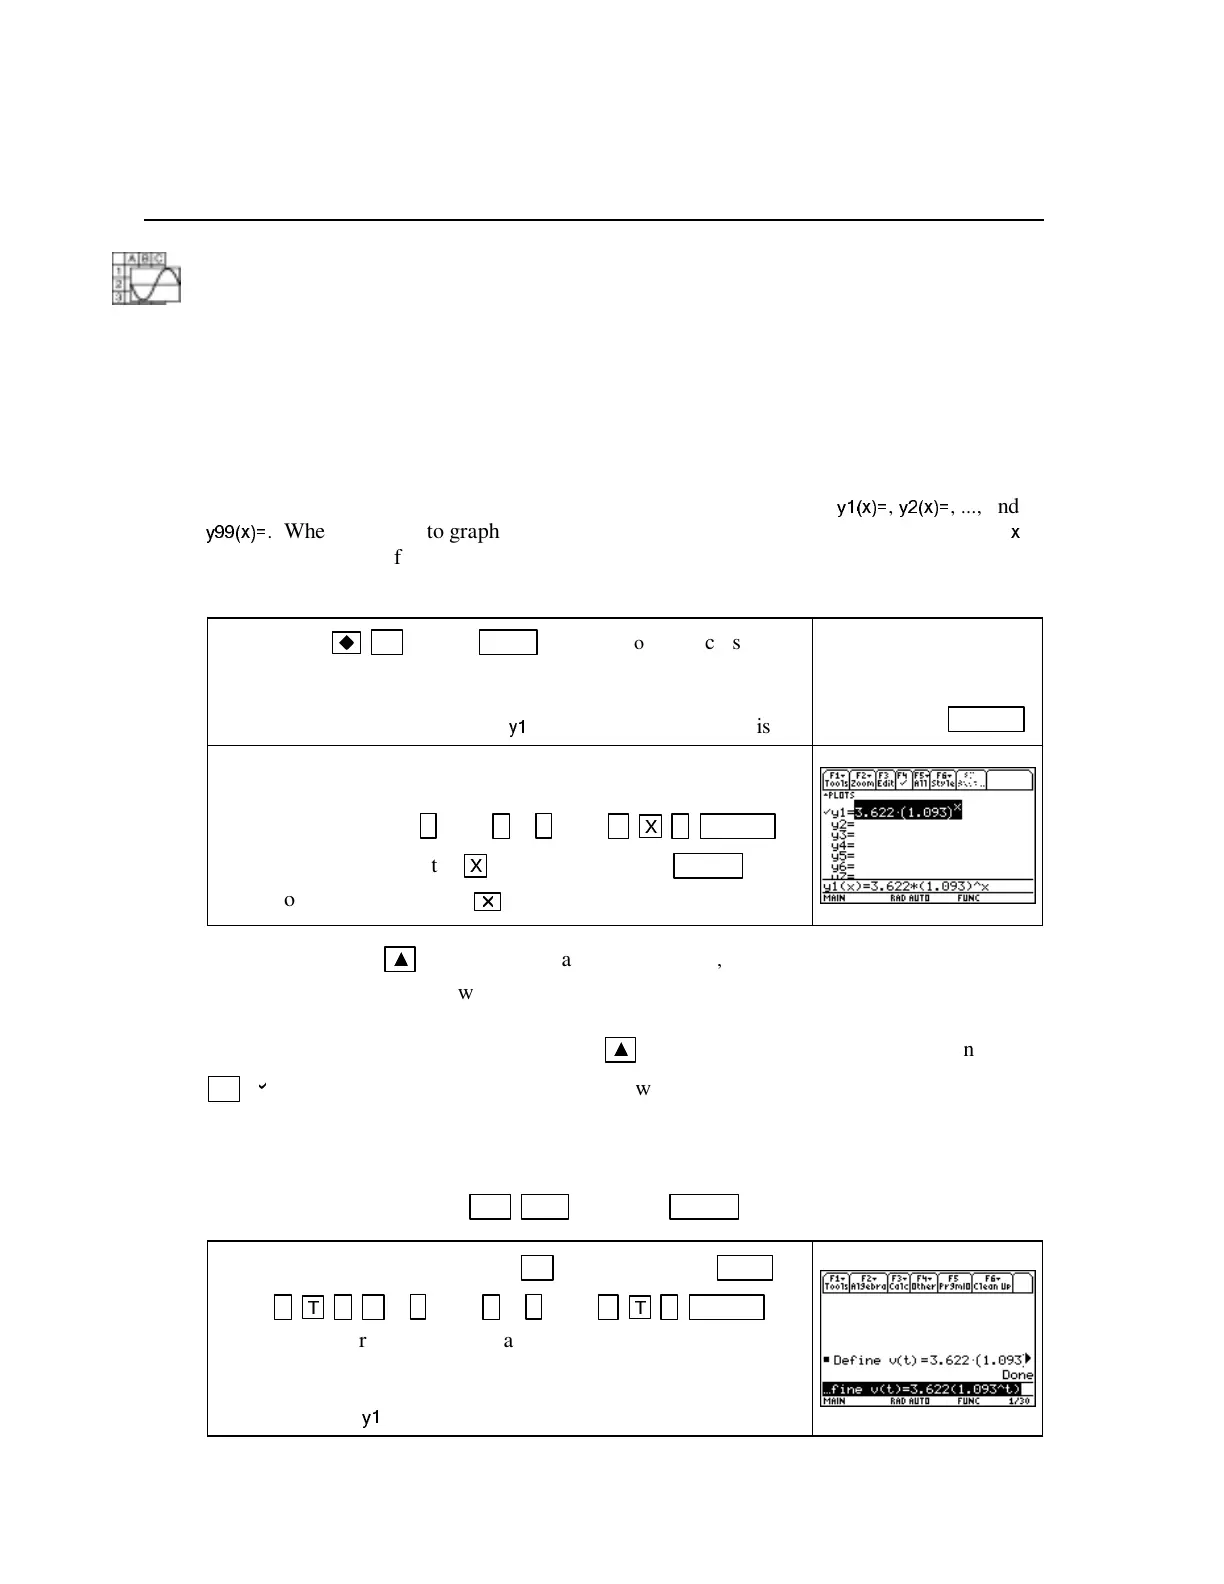
We intend to graph this equation, so the input variable must be
called x, not t. Enter the right-hand side of the equation,
3.622(1.093
x
), with
3 . 622 ( 1 . 093 ^
X
) ENTER .
Note that you must use the
X
key for x (under the
HOME
key), not the times sign key,
.
CAUTI ON: Press
▲
and notice the names
Plot 1, Plot 2,
…,
Plot 9
at the top of the
Y=
list.
These are the data plots that we will not use until Section 1.5. None of these plots should have a
check mark to the left of the name when you are graphing an equation and not graphing data
points. If any of these has a check mark, use
▲
until the cursor is on the plot name and press
F4 [
b
]
to make the check mark go away. Otherwise, you may receive an error message.
DEFI NI NG A FUNCTION ON THEHOME SCREEN Functions can be entered in the
graphing list or defined on the home screen. We illustrate both of these methods, and you can
use the one you prefer. Press
2nd ESC (QUIT)
or
HOME
to return to the home screen.
Type in v(t) = 3.622(1.093
t
)with
F4 [Other] 1 [Define] alpha
0(V) (
T
) = 3 . 622 ( 1 . 093 ^
T
) ENTER .
On the home screen, any letter can be used for the variable.
Note that if you prefer, you can enter the equation with x instead
of t as the input variable. (The TI-89 now knows this function
by two names:
y1
and v.)
 Loading...


