TI-89 Guide
TI89-7
Copyright © Houghton Mifflin Company. All rights reserved.
1.1.2 DRAWI NG A GRAPH As is the case with most applied problems in Calculus Concepts,
the problem description indicates the valid input interval. Consider Example 4 of Section 1.1:
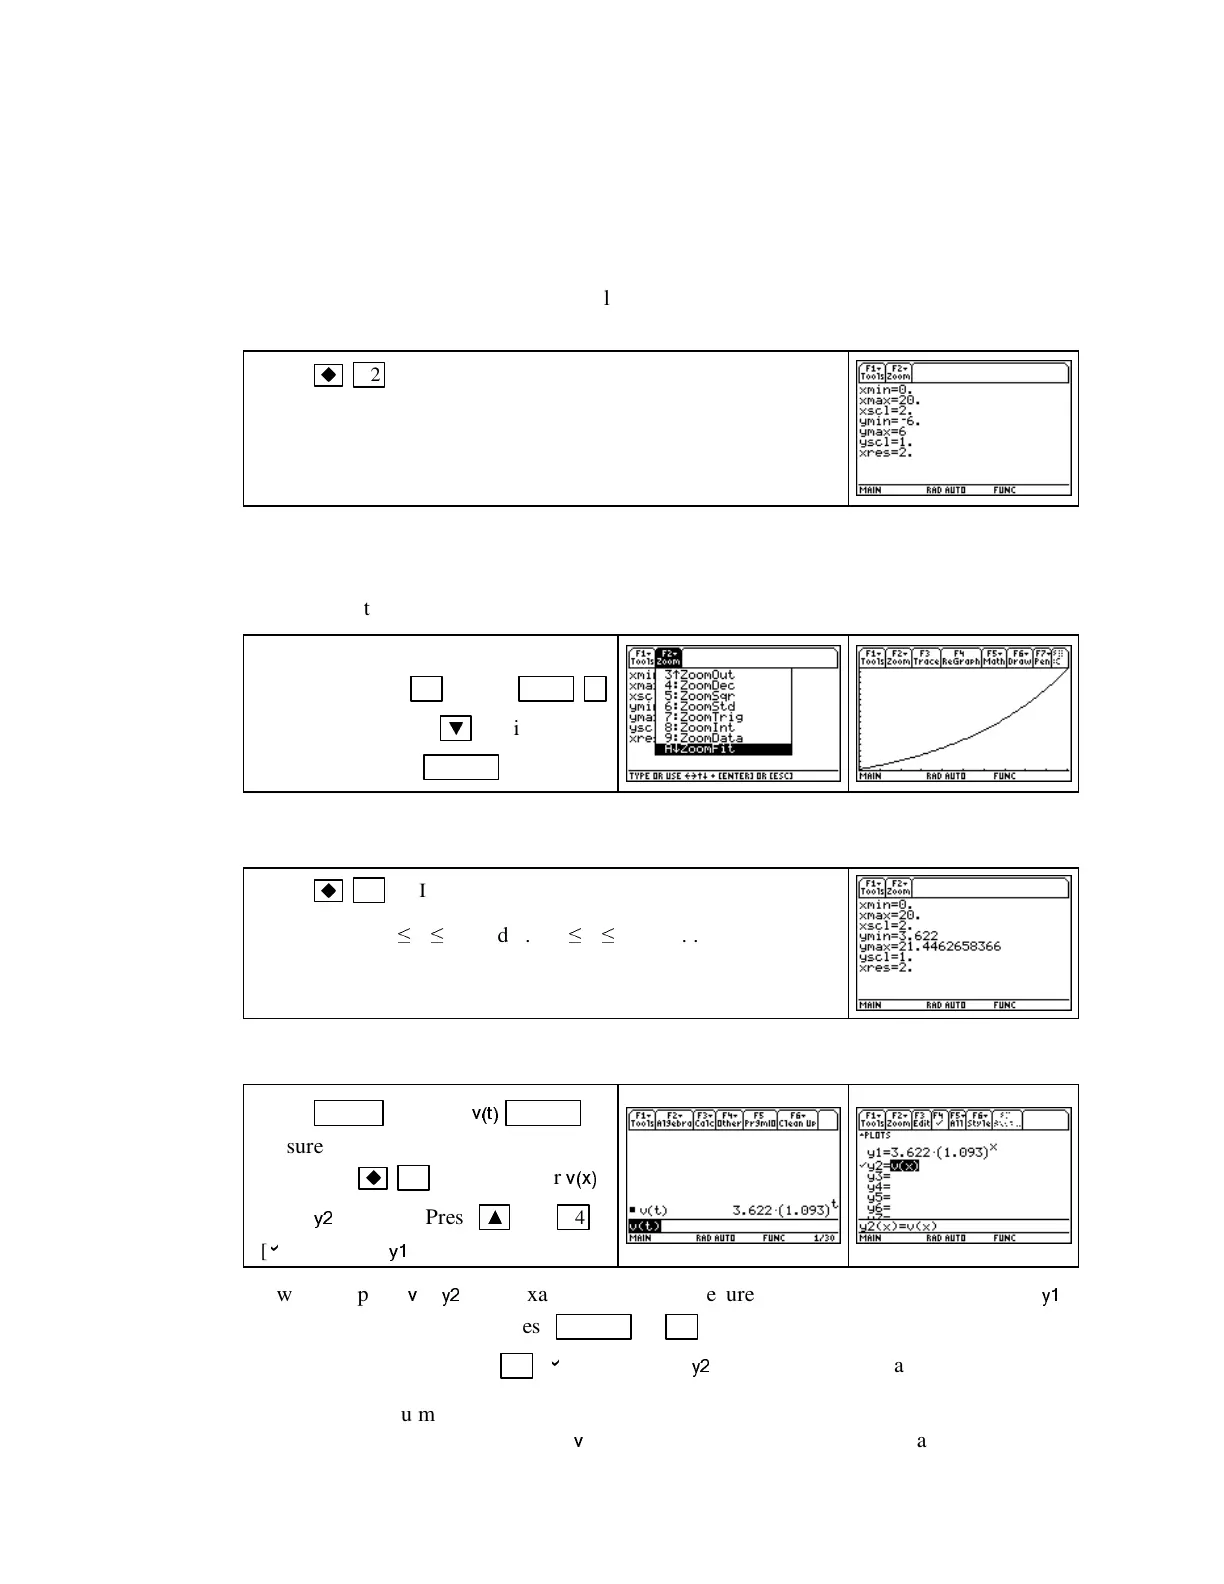
The value of a piece of property between 1980 and 2000 is given by v(t) = 3.622(1.093
t
)
thousand dollars where t is the number of years since the end of 1980.
The input interval is 1980 (t = 0) to 2000 (t = 20). Before drawing the graph of v on this inter-
val, have the function v enteredinthe
Y=
list using x as the input variable. (See Section 1.1.1 of
this Guide.) We now draw the graph of v for x between 0 and 20.
Press
F2 (WINDOW)
to set the view for the graph. Enter 0
for
xmin
and 20 for
xmax.
(For 10 tick marks between 0 and 20,
enter 2 for
xscl.
If you want 20 tick marks, enter 1 for
xscl,
etc.;
xscl
does not affect the shape of the graph. Ignore the other
numbers − we set their values in the next set of instructions.)
The numbers
xmin
and
xmax
are, respectively, the settings for the left and right edges of the
viewing screen, and
ymin
and
ymax
are, respectively, the settings for the lower and upper edges
of the viewing screen.
xscl
and
yscl
set the spacing between the tick marks on the x-andy-axes.
(Leave
xres
set to the default value of 2 for all applications in this Guide.)
To have the TI-89 determine the view for
the output, press
F2 [Zoom] alpha =
(A) [ZoomFit]
or use
▼
to highlight
ZoomFit
and press
ENTER .
Note that any vertical line drawn on this graph intersects it in only one point, so the graph does
represent a function.
Press
F2 (WINDOW)
to see the view set by
ZoomFit.
The view has 0
≤
x
≤
20 and 3.622
≤
y
≤
21.446... .
(Note that
ZoomFit
did not change the x-values that you set
manually.)
Let’s now explore how to graph with the function defined on the home screen as v(t).
Press
HOME
and type
v(t)
ENTER
to
be sure you are using the correct func-
tion. Press
F1 (Y
=
)
and enter
v(x)
in the
y2
location. Press
▲
and
F4
[
b
]
to turn off
y1
.
Draw the graph of
v
=
y2
using exactly the same procedure as that for drawing the graph of
y1
.
If you need to edit a function, press
ENTER
or
F3 [Edit]
to move the cursor to the entry line
from the graphing list. Press
F4 [
b
]
to deactivate
y2
after you draw its graph.
WARNING: You must use x as the input variable when in the
Y
=
list. If you use t or another
letter inside the parentheses following
v
, you will likely get an “undefined variable” message.
 Loading...


