TI89-8
Chapt er 1
Copyright © Houghton Mifflin Company. All rights reserved.
1.1.3 MANUALLY CHANGI NG THE VI EW OF A GRAPH We just saw how to have the TI-
89 set the view for the output variable. Whenever you draw a graph, you can also manually set
or change the view for the output variable. If for some reason you do not have an acceptable
view of a graph or if you do not see a graph, change the view for the output variable with one of
the zoom options or manually set the
WINDOW
until you see a good graph. (We will later
discuss other zoom options.) We continue using the function v in Example 4 of Section 1.1, but
assume here that you have not yet drawn the graph of v.
Press
F2 (WINDOW)
, enter 0 for
xmin
,20for
xmax
,and
(assuming we do not know what to use for the vertical view),
enter some arbitrary values for
ymin
and
ymax.
(This graph was
drawn with
ymin
=
−
5and
ymax
=7). Press
F3 (GRAPH).
NOTE: If you see nothing on the screen, press
F1 (Y
=
)
and highlight
y1
. If there is no
checkmarknextto
y1,
press
F4 [
b
]
and
F3 (GRAPH).
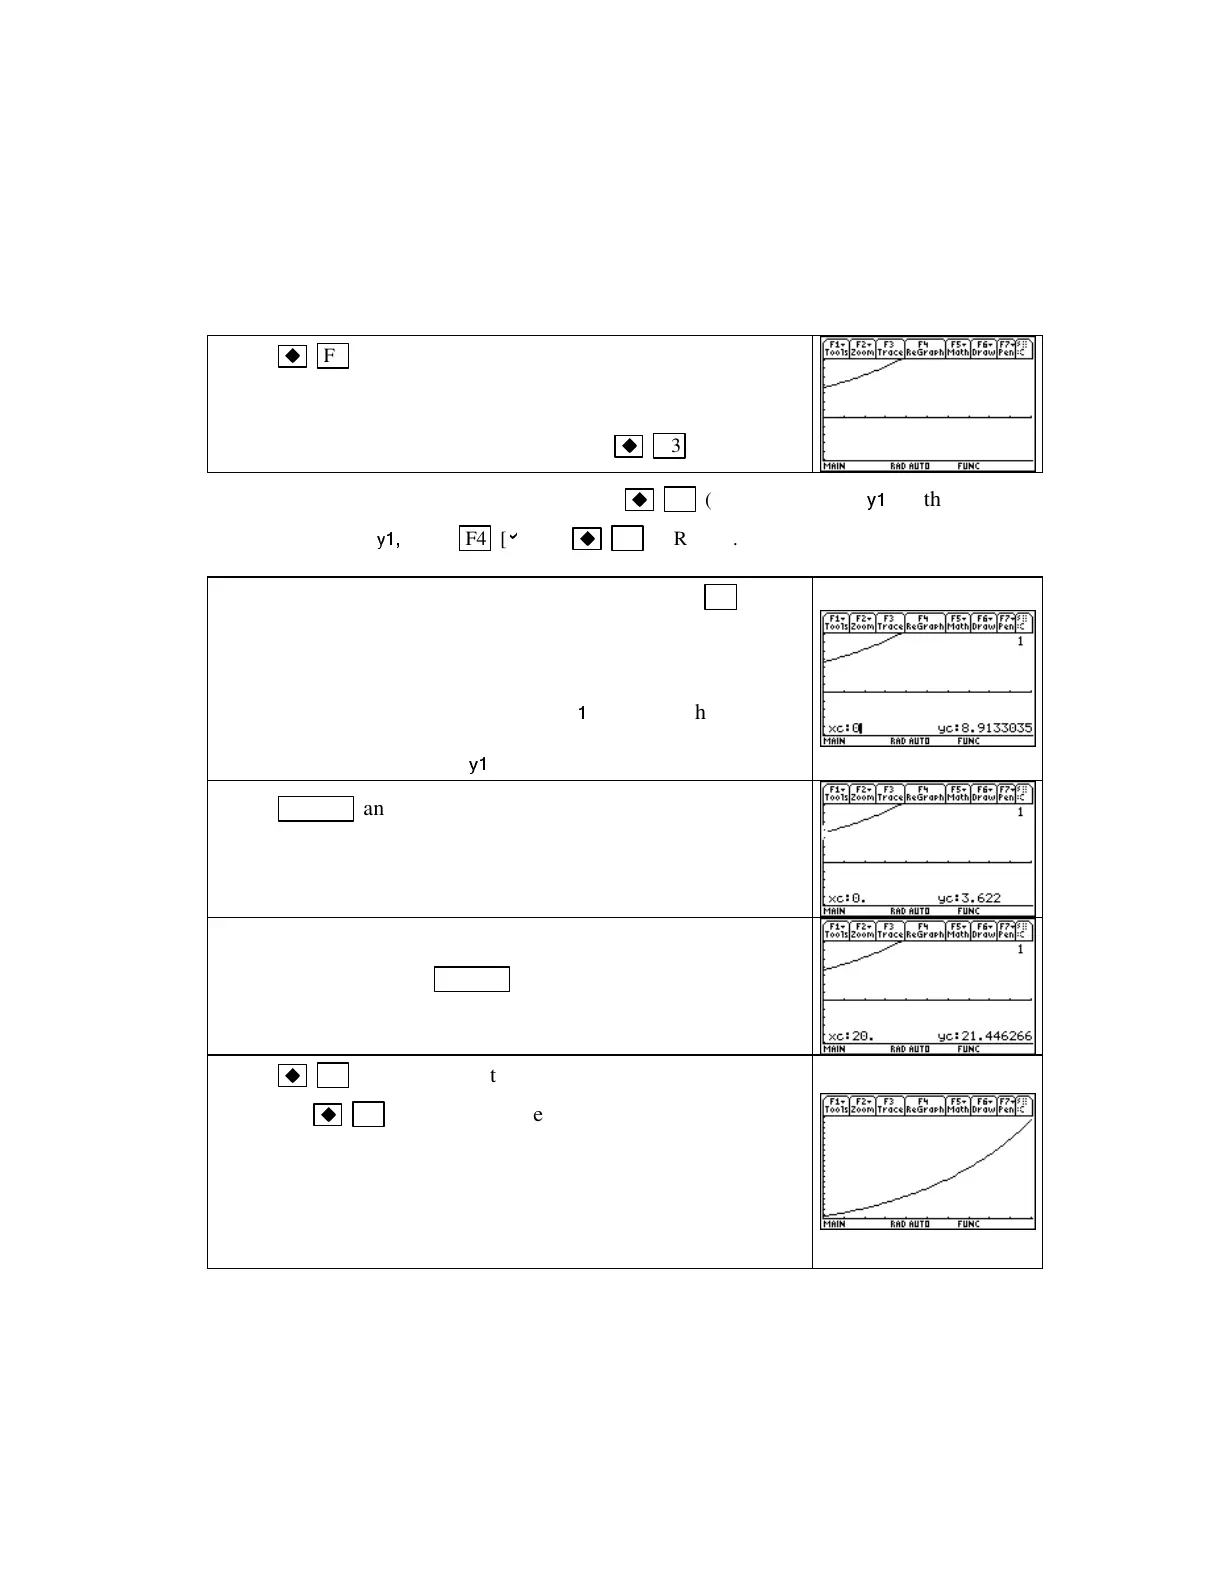
Evaluating Outputs on the Graphics Screen: Press
F3
[Trace].
*
Recall we are given in this application that the input
variable is between 0 and 20. If you now type the number that
you want to substitute into the function whose graph is drawn,
say
0
, you see the screen to the right. A
1
appears at the top
right of the screen because the equation of the function whose
graph you are drawing is in
y1
.
Press
ENTER
and the input value is substituted in the function.
The input and output values are shown at the bottom of the
screen. (This method works even if you do not see any of the
graphonthescreen.)
Substitute the right endpoint of the input interval into the
function by pressing
20 ENTER
. We see that two points on
this function are approximately (0, 3.622) and (20, 21.446).
Press
F2 (WINDOW)
,enter
3.5
for
ymin
and
22
for
ymax
,
and press
F3 (GRAPH).
If the graph you obtain is not a
good view of the function, repeat the above process using x-
values in between the two endpoints to see if the output range
should be extended in either direction. (Note that the choice of
the values 3.5 and 22 was arbitrary. Any values close to the
outputs in the points you find are also acceptable.)
*
Instead of using TRACE, you could use the TI-89 TABLE or evaluate the function at 0 and 20 on the
home screen to find the range of values for the output value. We later discuss using these features.
1.1.4 TRACI NG TO ESTI MATE OUTPUTS You can display the coordinates of certain points on
the graph by tracing. Unlike the substitution feature of
TRACE
that was just discussed, the x-
values that you see when tracing the graph depend on the horizontal view that you choose. The
output values that are displayed at the bottom of the screen are calculated by substituting the x-

 Loading...


