CHAPTER 3
Instrument Operation
3-1
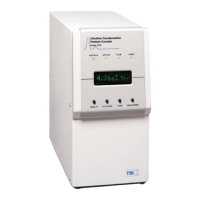
This chapter contains operating information for the Model 3786
Ultrafine Water-based Condensation Particle Counter (UWCPC).
The Display
The Display button on the front panel selects what data or status
information is shown on the graphics display. During the warm-up
period the Display button allows selection between the Warm-up
screen and the Status screen. Once warm-up is complete, pressing
the Display Button switches the information shown on the graphics
display. Up to four different screens of information can be
displayed. These screens are the Primary Concentration, Bar
Graph, Totalizer, and the Status screen. The content of each of
these screens is given below.
Primary Concentration Screen
1.34e4 #/cm
3
The Primary Concentration screen is updated each second with an
indication of the particle concentration. Displayed values range
from 0.00 particles/cm
3
to 9.99e
5
particles/cm
3
. For concentrations
of 20.0 particles/cm
3
or higher, the display value is calculated on
data measured over the previous second. For concentrations less
than 20.0 particles/cm
3
, six seconds of particle count data is used
in the calculation of particle concentration. At this level of
concentration, a single particle represents 0.03 particles/cm
3
, so
there will be significant variation in displayed values from one
display update to the next because of the statistical nature of the
arrival of particle at the detector. For a more statistically accurate
measure of particle concentrations consider using the Totalizer
function. The “OVER” is displayed in the upper right-hand corner of
the screen when the measured live-time is less than 40% (0.4
seconds) of the real time. This indicates that the particle
concentration reported is over the specified range of the
instrument.