85
Blast Chiller Touch Screen Manual
85
Rev08/04/2015
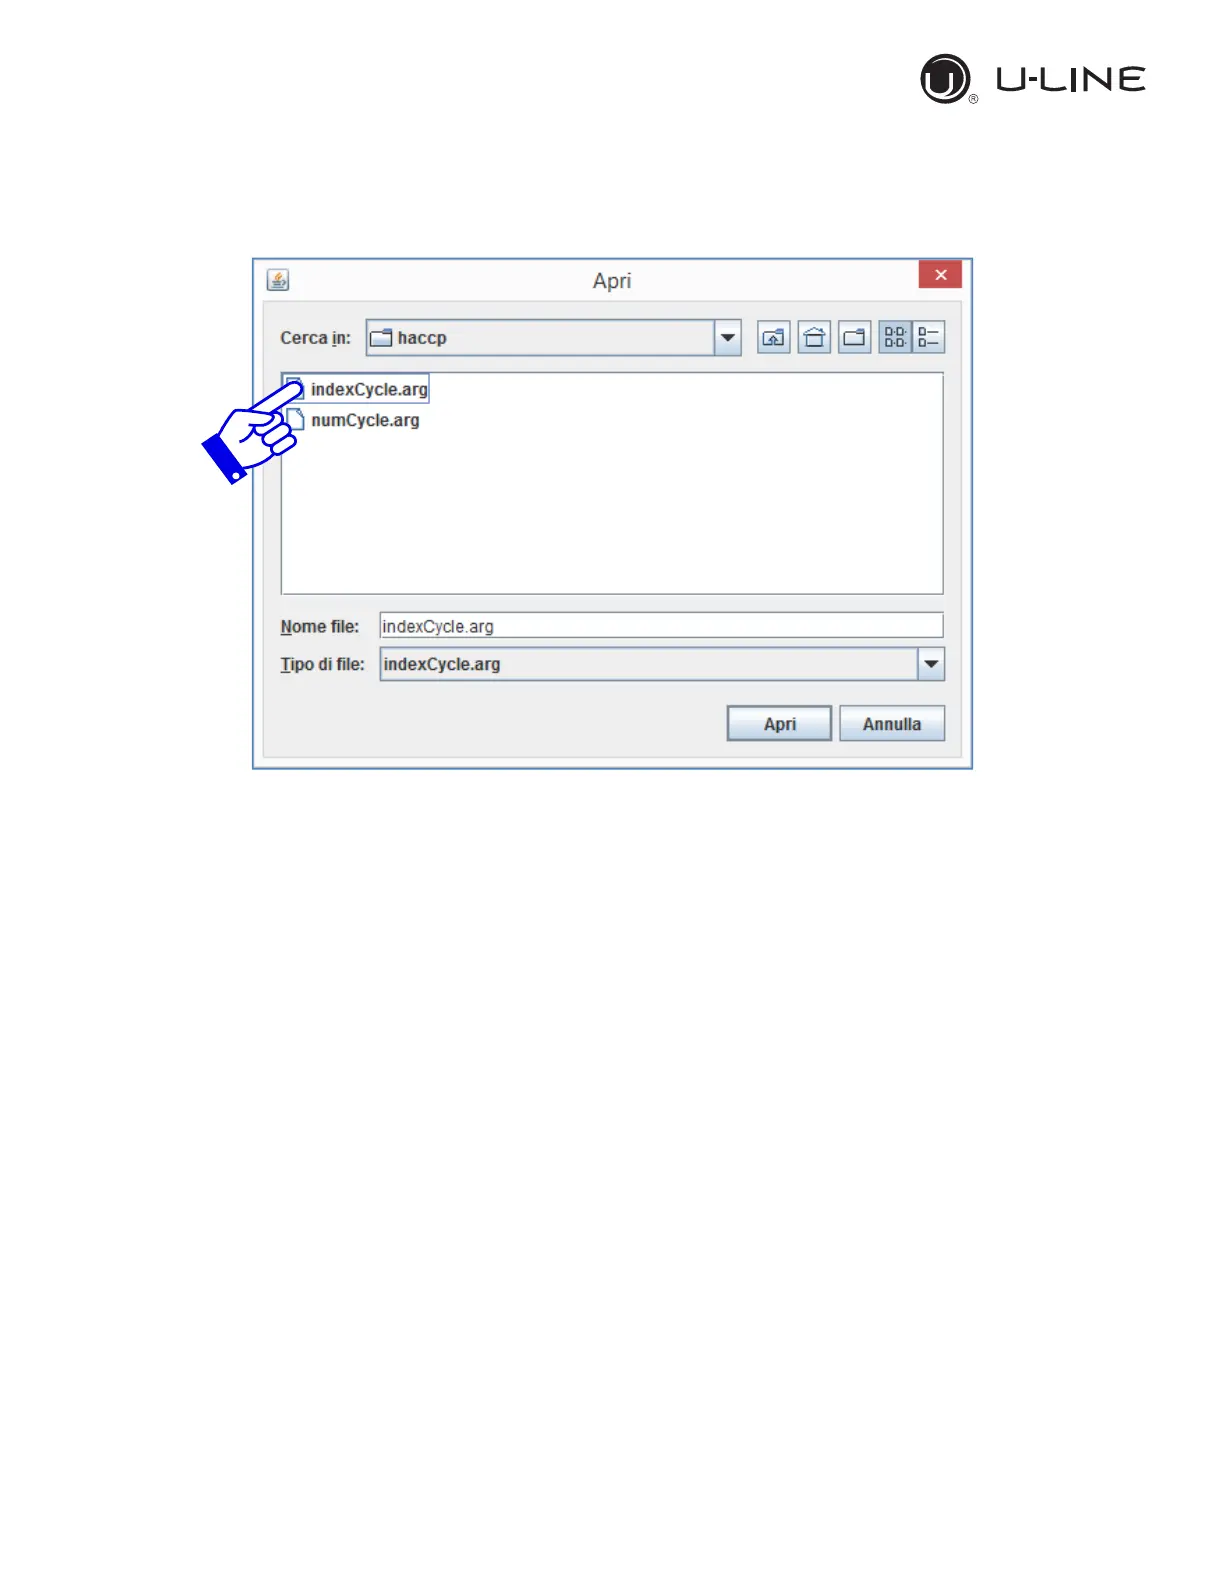
Once that the .arg files show in the box, double click on left side of
indexCycle.arg
Select the cycle to graph from the right column, watching at date, starting hour
and cycle code (see encoding scheme at the above paragraph). See example of
cycle graph at the following page. Right click on the graph to print or save a
.png file. Scroll up or down to zoom in and out. To zoom in a specific area of
the graph, just select the area with the mouse.
 Loading...