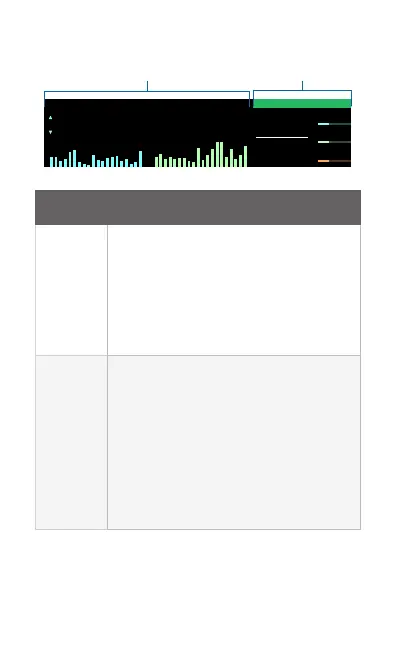
Statistics Screen
5.4
Gbps
12.1
Gbps
21.3
GB
284
GB
71.8
1.59
34%CPU
34%RAM
TMP.
LATENCY
MS
CLIENTS
743
3
G
M
34
o
c
System Details
Statistics
Section of
LCD
Information Displayed
Statistics
Statistics on uploaded (blue) and downloaded
(green) data:
• Throughput Total throughput speed in
bps/kbps/Mbps/Gbps
• Bytes Total bytes (B)*
• Packets Total packets*
• Bar Graphs Plots of data uploaded and
downloaded
System
Details
Information on the system:
• Host name
• IP address of the primary WAN port
• Latency in ms for the Primary WAN or
selected port
• Number of clients (active connections) for
the Primary WAN or selected port
• CPU and RAM usage percentage (red
indicates usage of 90% or greater)
• Temperature of CPU in °C (red indicates
temperature of 85 °C or greater)
* Units:
k = 2
10
= 1024
M = 2
20
≈ 1,000,000
G = 2
30
≈ 1,000,000,000
T = 2
40
≈ 1,000,000,000,000
P = 2
50
≈ 1,000,000,000,000,000
 Loading...