EXCEL 2000 Series Operator Manual
5-3
Software Summary Chart
Introduction
This chapter describes how to use the color-coded Software
Summary Chart, the map of the software, which is located at the
end of this chapter.
Frame: Definition
Each set of commands visible on the printer display screen at one
time are called frames. Each frame available in the software is
shown on the Software Summary Chart.
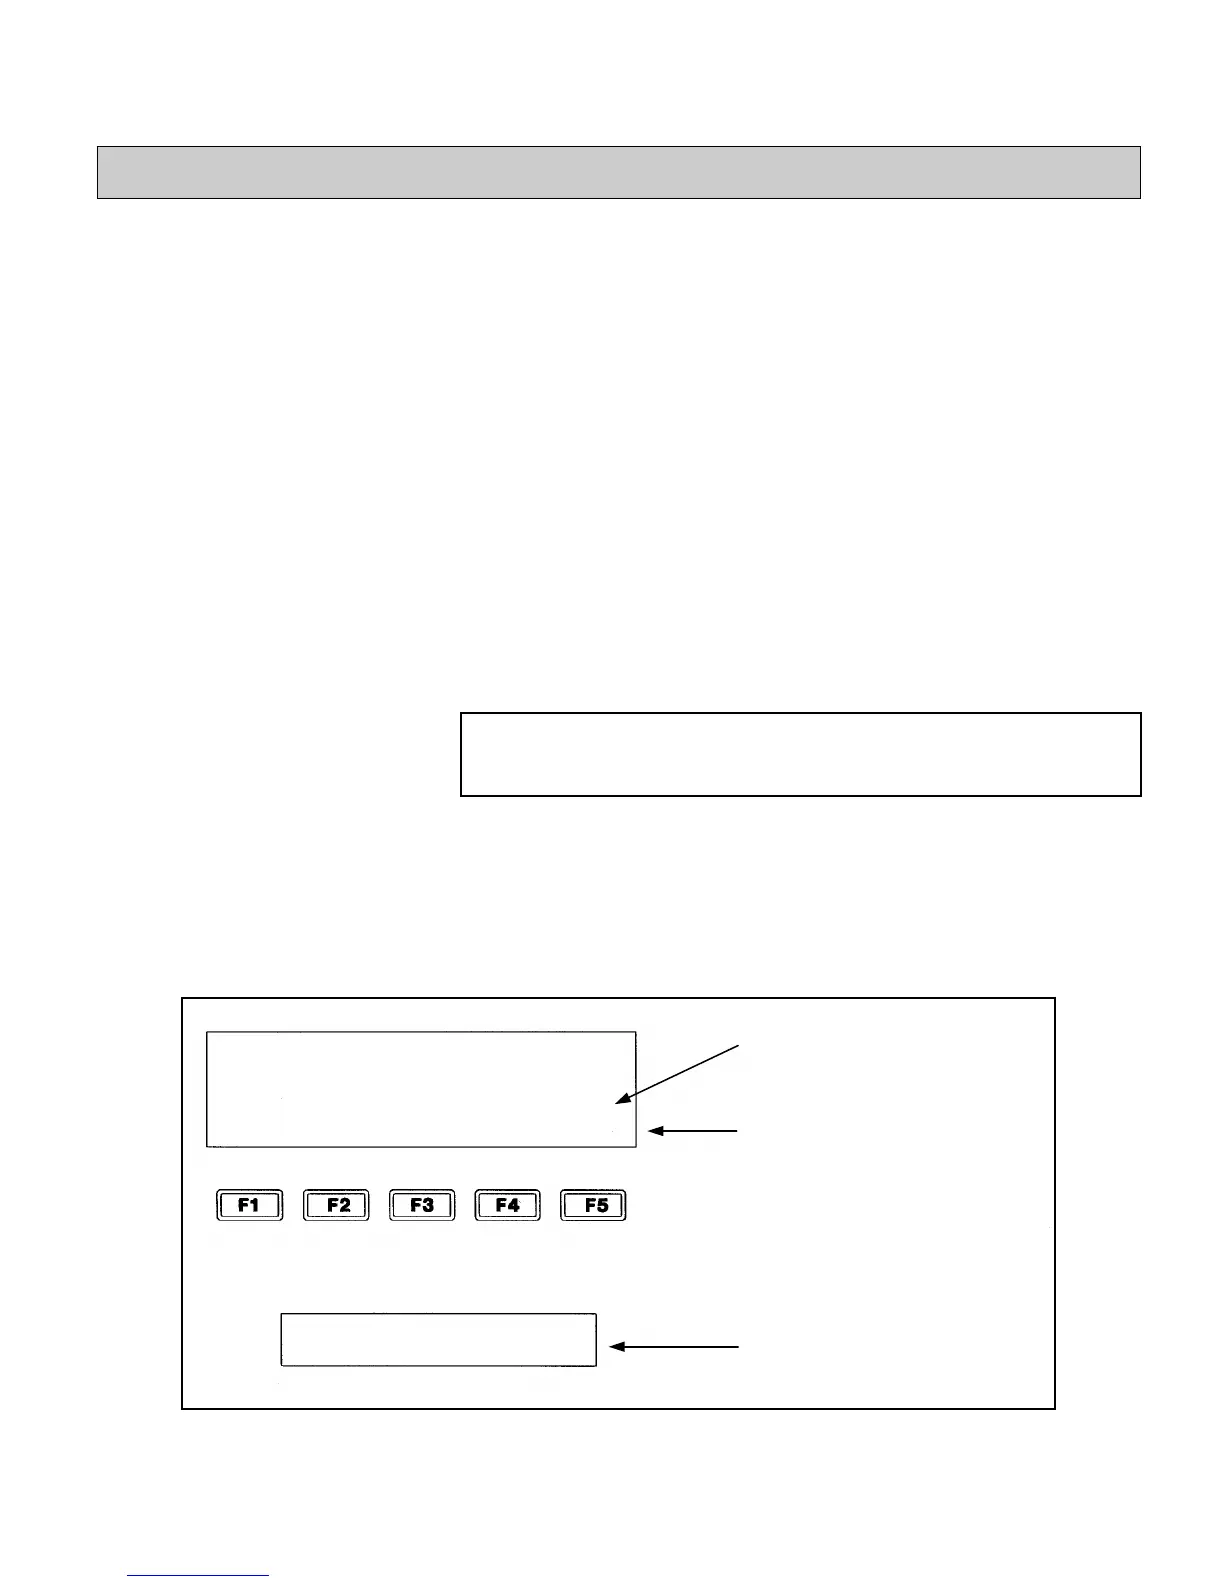
When you turn the printer On, Frame <01 EDIT> appears in the
display screen. The Software Summary chart, therefore, begins
with this frame. Refer to the top of the Software Summary chart at
the end of this chapter to locate Frame <01 EDIT>. Also refer to
Figure 5-1 below for illustrations of Frame <01 EDIT>.
NOTE:The name of the frame, such as “Frame <01 EDIT>,” is
the text that appears in the frame above the F5 key.
(Refer to Figure 5-1.)
Note the colors on the Software Summary Chart: white, orange,
yellow, red, blue, and green. Each color denotes a different mode:
Edit, Character Set-up, Insert, Service, System Set-up, and Print
Set-up, respectively. The modes are described in more detail on the
following pages.
Figure 5-1. Frame <01 EDIT>
Frame Name
Frame <01 EDIT> as it
appears in the display
screen
Frame <01 EDIT> as
shown in the Software
Summary Chart
CLEAR
MESSAGE
VIEW
PRINT
PRINT
MESSAGE
01
EDIT
CLEAR
MESSAGE
VIEW
PRINT
PRINT
MESSAGE
01
EDIT


 To Next Page