Supplied By www.heating spares.co Tel. 0161 620 6677
4
Linea
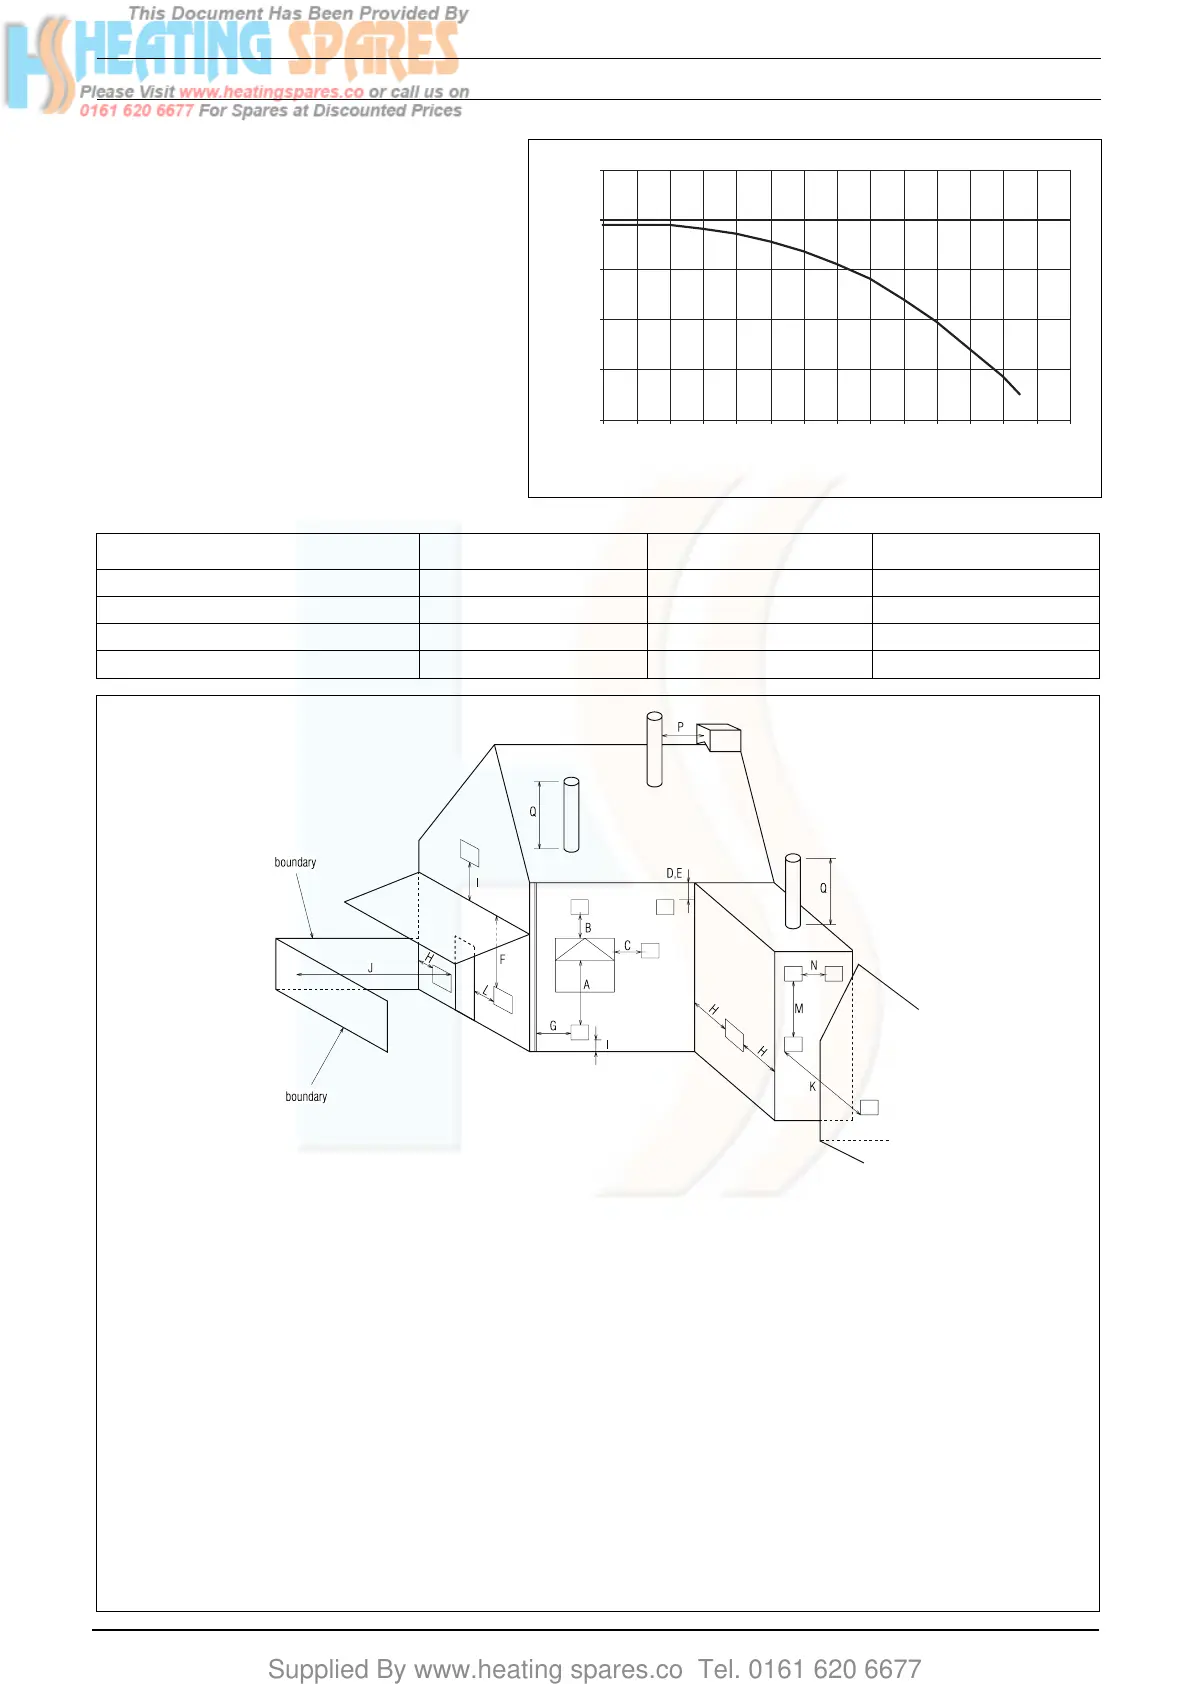
2.11 PUMP DUTY
Fig. 3 shows the flow-rate available – af-
ter allowing for pressure loss through the
appliance – for system requirements.
When using this graph, apply only the
pressure loss of the system. The graph
is based on a 20
o
C temperature differen-
tial.
SECTION 2 TECHNICAL DATA
Fig. 3
Water pressure (mbar)
Litres Per Hour
100
200
300
400
500
600
0 100 200 300 400 500 600 700 800 900 1000 1100 1200 1300 1400
2.12 Emissions
Appliance
NOx max/min 160/140 180/120 150/130
CO max/min 120/120 140/100 130/130
CO2 max/min 6.95/3.45 6.70/3.20 7.0/3.40
CO/CO2 ratio max/min 0.0017 to 1/0.0035 to 1 0.0021 to 1/0.0031 to 1 0.0019 to 1/0.0038 to 1
726 730
Fig. 4
735
Key Location Minimum distance
A Below an opening (window, air-brik, etc.) 300 mm
B Above an opening (window, air-brik, etc.) 300 mm
C To the side of an opening (window, air-brik, etc.) 300 mm
D Below gutter, drain-pipe, etc. 75 mm
E Below eaves 200 mm
F Below balcony, car-port roof, etc. 200 mm
G To the side of a soil/drain-pipe, etc. 150 mm
H From internal/external corner or boundary 300 mm
I Above ground, roof, or balcony level 300 mm
J From a surface or boundary facing the terminal 600 mm
K From a terminal facing a terminal 1200 mm
L From an opening in the car-port into the building 1200 mm
M Vertically from a terminal on the same wall 1500 mm
N Horizontally from a terminal on the same wall 300 mm
P From a structure to the side of the vertical terminal 300 mm
Q From the top of the vertical terminal to the roof flashing As determined by the fixed collar
of the vertical terminal
 Loading...