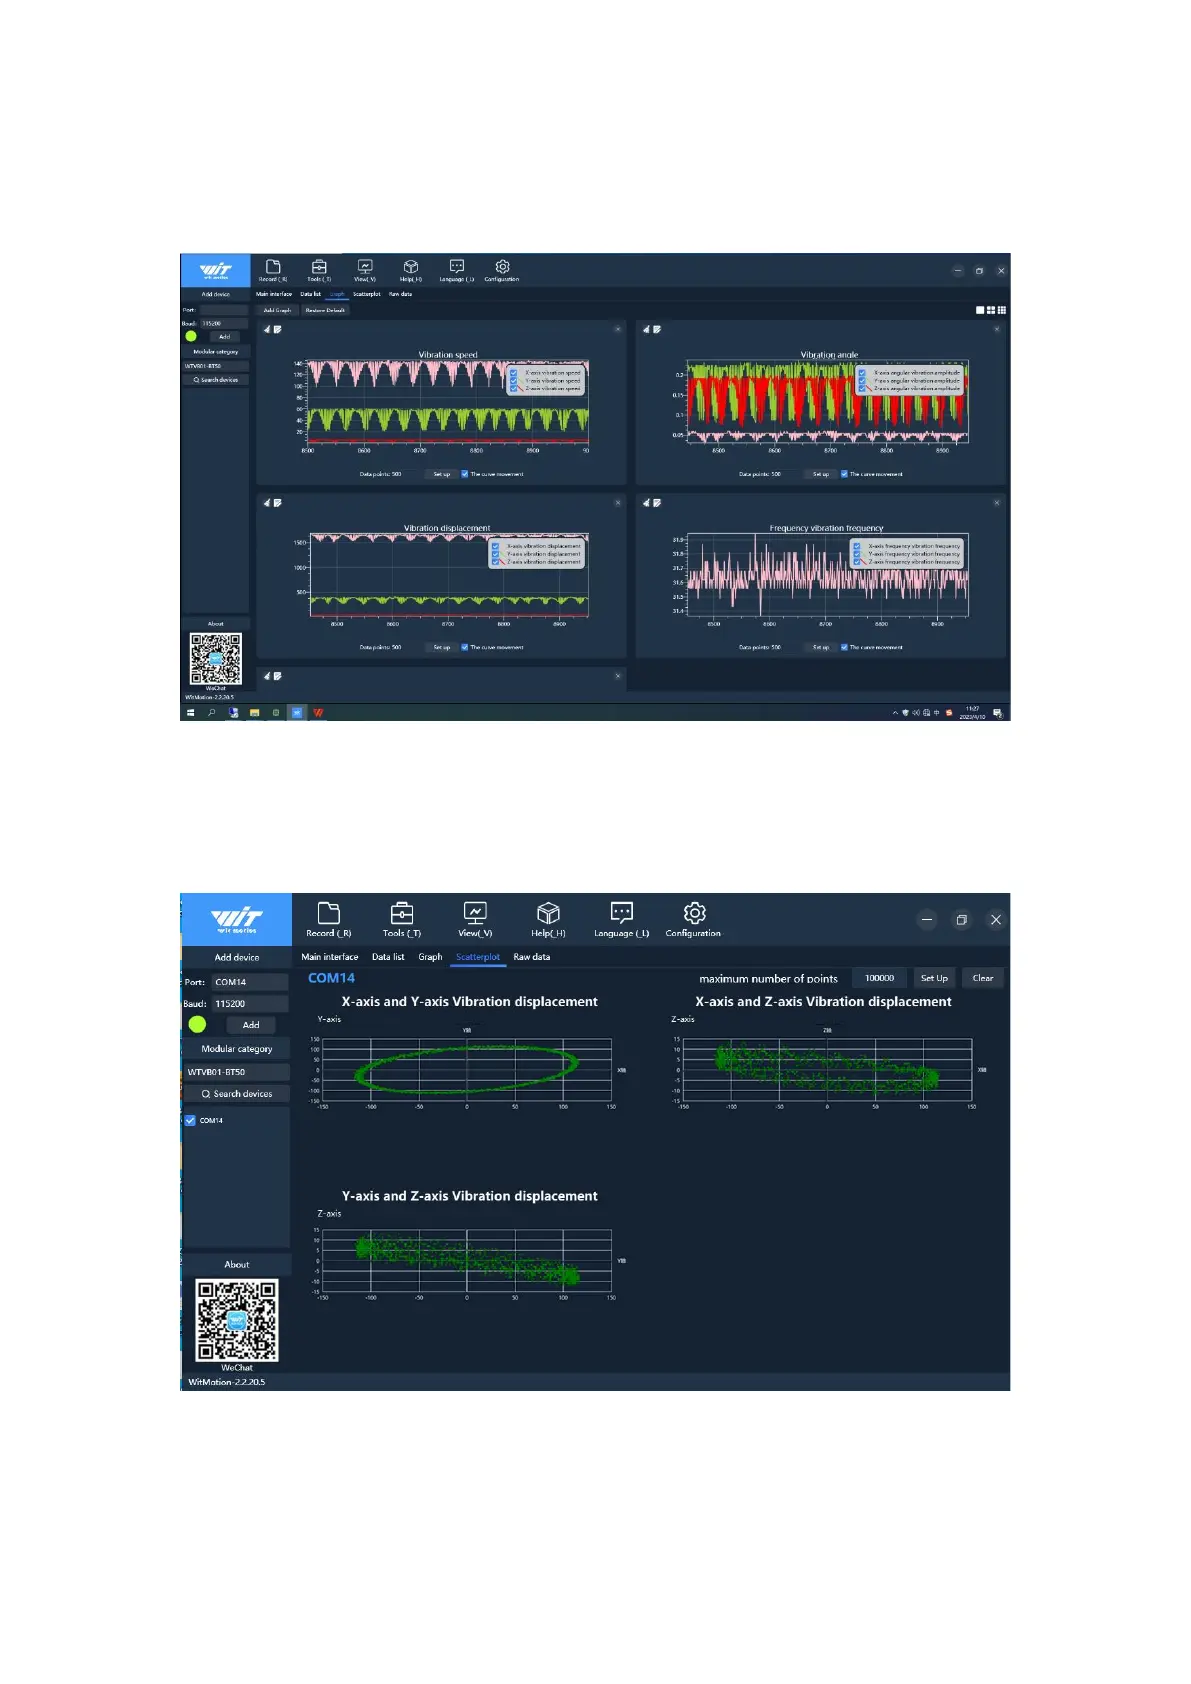
Click on the graph, there are curves of vibration velocity, vibration Angle,
vibration displacement and temperature (normal mode); In high-speed mode, only the
vibration displacement curve has data, as shown in the figure below:
3.4 Scatter diagram
In order to obtain the complete vibration displacement scatter diagram, it is
recommended to use the high-speed mode to view
4. Configure the software
4.1 Restoring Settings