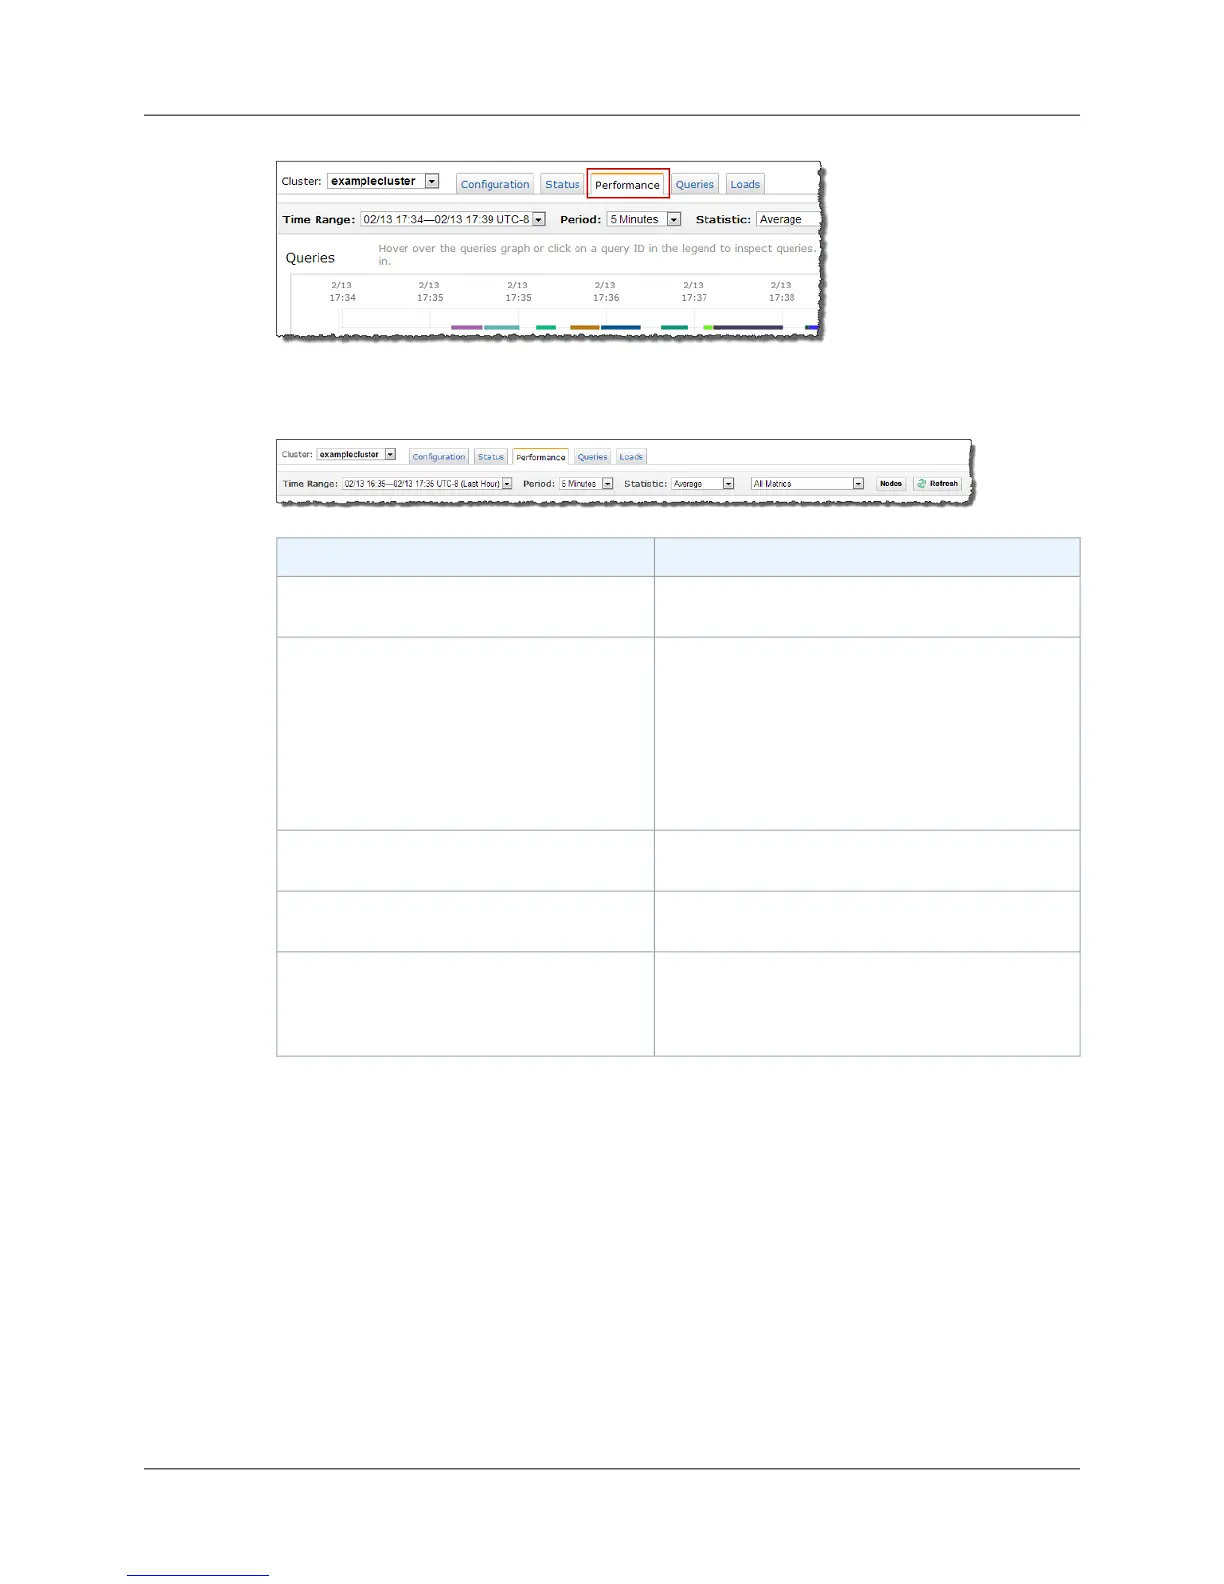
By default, the performance view displays cluster performance over the past hour. If you need to fine
tune the view you have filters that you can use as described in the following table.
Use this filter...To...
Select a time range from the Time Range drop
down. By default, the last hour is shown.
Change the time range for which data is
displayed
Select a period from the Period drop down. By
default, a 5 minute period is shown. Use a period
smaller than 5 minutes if you need more detail when
investigating a metric (drilling in) and displaying
metrics over a small time period, for example 10
minutes. Similarly, use a period greater than 5
minutes when viewing metrics over a large period
of time, for example, days.
Change the period for which data is displayed
Select a statistic from the Statistic drop down. By
default, the Average statistic is used.
Change the statistic that is displayed for
metrics
Select a metrics from the Metrics drop down. By
default, all metrics are shown.
Change what metrics are shown, all or a
specific metric
Click the Nodes button. By default, node data for a
given metric is shown on a combined graph. If you
choose to display node data on separate graphs,
you can additionally show or hide individual nodes.
Change whether node metrics are displayed
separately or together on the same graph
Cluster Metrics - Examples
The following example shows CPUUtilization and NetworkReceiveThroughput metrics for a single
node cluster. In this case the graphs for cluster metrics show one line marked as Shared since the leader
and compute node are combined.The example shows that multiple queries were run in the time period
shown. On the Queries graph the cursor is positioned over the query running at the peak values of the
two metrics and the Query ID is displayed on the right.You could then click the Query ID to find out more
about the query running.
API Version 2012-12-01
73
Amazon Redshift Management Guide
Viewing Cluster Performance Data