EasyManuals Logo

Amazon Redshift User Manual

Amazon Redshift
131 pages
To Next Page IconTo Next Page
To Previous Page IconTo Previous Page
Page #79 background imageLoading...
Page #79 background image
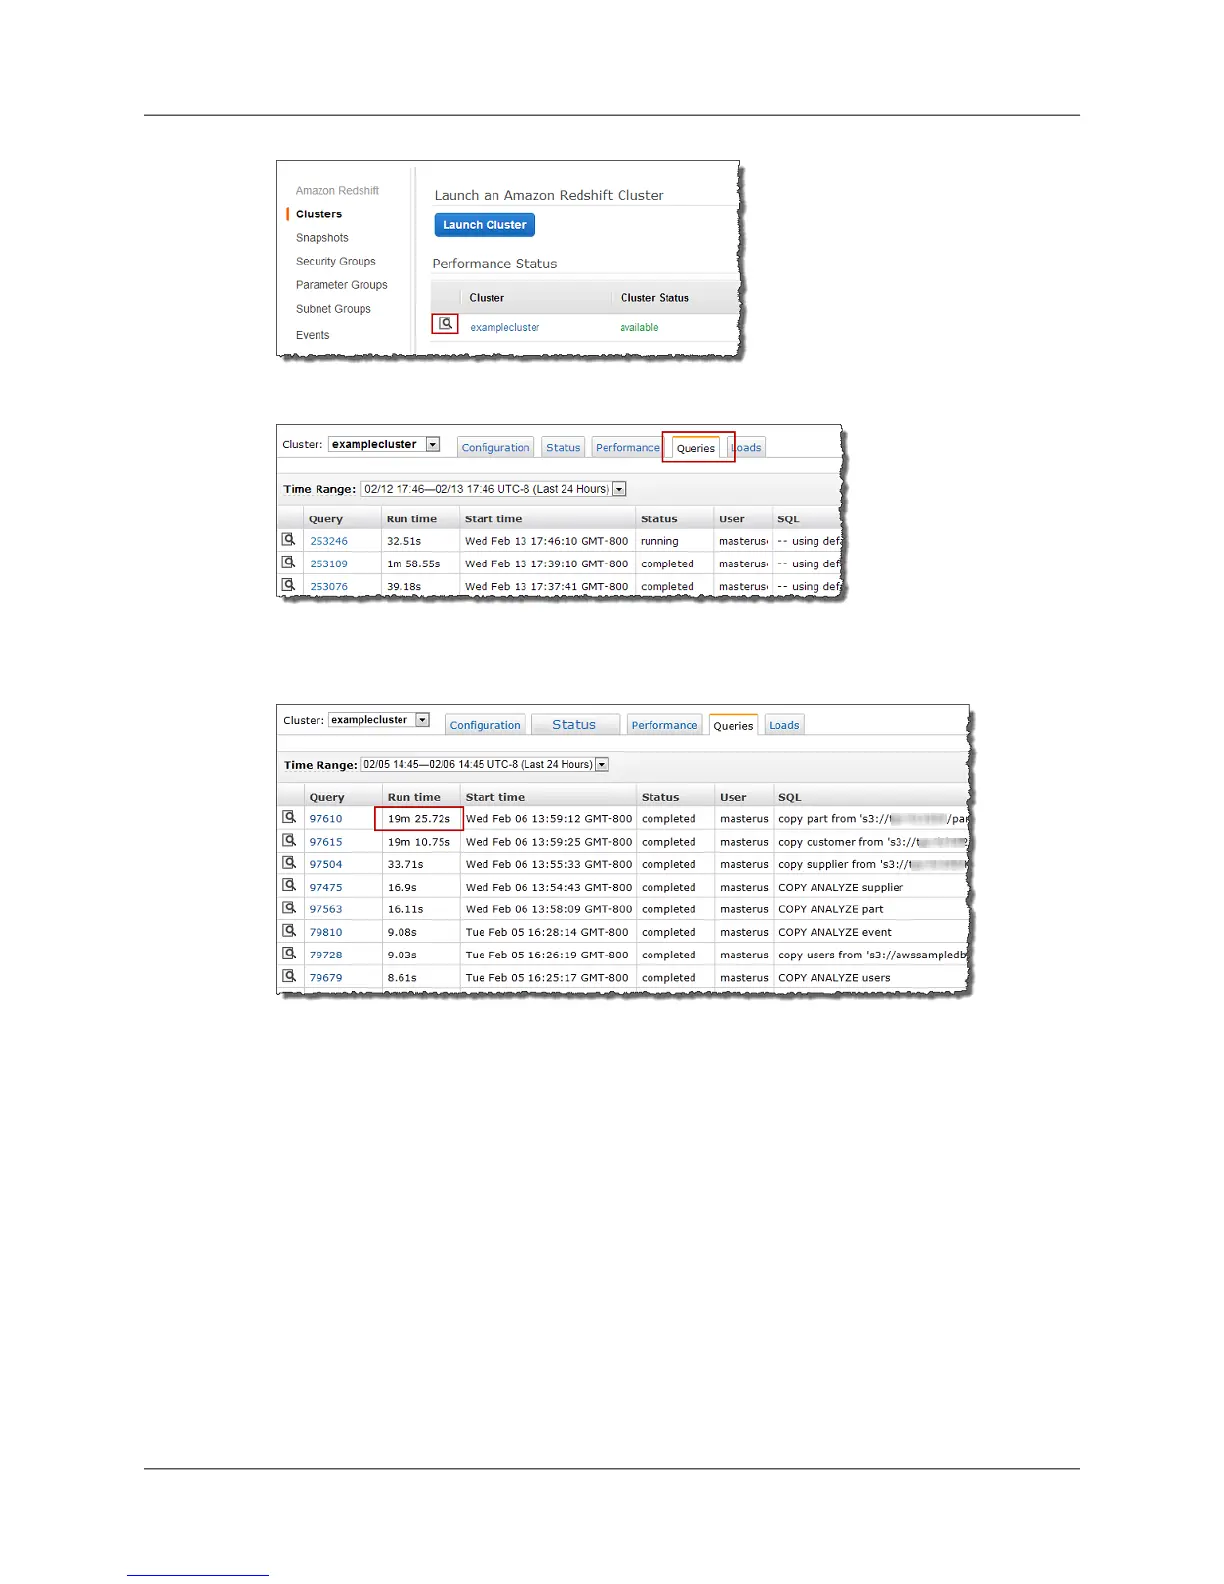
4. Select the Queries tab.
5. In the query list find the query you want to work with, and click the query ID in the Query column.
In this example, the queries are sorted by Run time to find the query with the maximum run time.
6. In the new Query tab that is opened you can view the details of the query.
To find the cluster metrics, scroll to the bottom of the query details. For more examples of the Query
tab, see Cluster Metrics During Query Execution - Examples (p. 76)
In the following example, the CPUUtilization and NetworkReceiveThroughput metrics are
displayed for the time that this query was running.
Tip
You can close the details of individual panes such as Query Properties or Loaded Files
to manage how details are displayed in the pane.
API Version 2012-12-01
75
Amazon Redshift Management Guide
Viewing Cluster Metrics During Query Execution

Table of Contents

Questions and Answers:

Question and Answer IconNeed help?

Do you have a question about the Amazon Redshift and is the answer not in the manual?

Amazon Redshift Specifications

General IconGeneral
ProviderAmazon Web Services (AWS)
Query LanguageSQL
Data StorageColumnar storage
SecurityEncryption at rest and in transit, VPC, IAM
BackupAutomated and manual snapshots
DeploymentCloud-based
TypeCloud-based data warehouse service
Primary UseData warehousing, analytics
IntegrationIntegrates with AWS services, BI tools, and ETL tools
Pricing ModelOn-demand and reserved instance pricing
Data CompressionColumnar storage with data compression
Performance OptimizationQuery optimization

Related product manuals