25
8
7
6
5
30 35 40
25
20
18
16
14
12
10
30 35 40
–50 5
9
8
7
6
10 15 20 25
–50 510
60
55
50
45
40
35
30
15 20 25
25 30 35 40
–5 0 5 10152025
3.5
3.0
2.5
2.0
1.3
1.2
1.1
1.0
Indoor air temp.
23°C
17
°C
Indoor air temp.
23°C
20
°C
17
°C
Indoor air temp.
23°C
27
°C
24°C
Indoor air temp.30
°C
Indoor air temp.30°
C
27
°C
24
°C
Indoor air temp.30°C
20
°C
17
°C
20
°C
27
°C
24°
C
Lo fan Hi fan
Lo fan Hi fan
Lo fan Hi fan
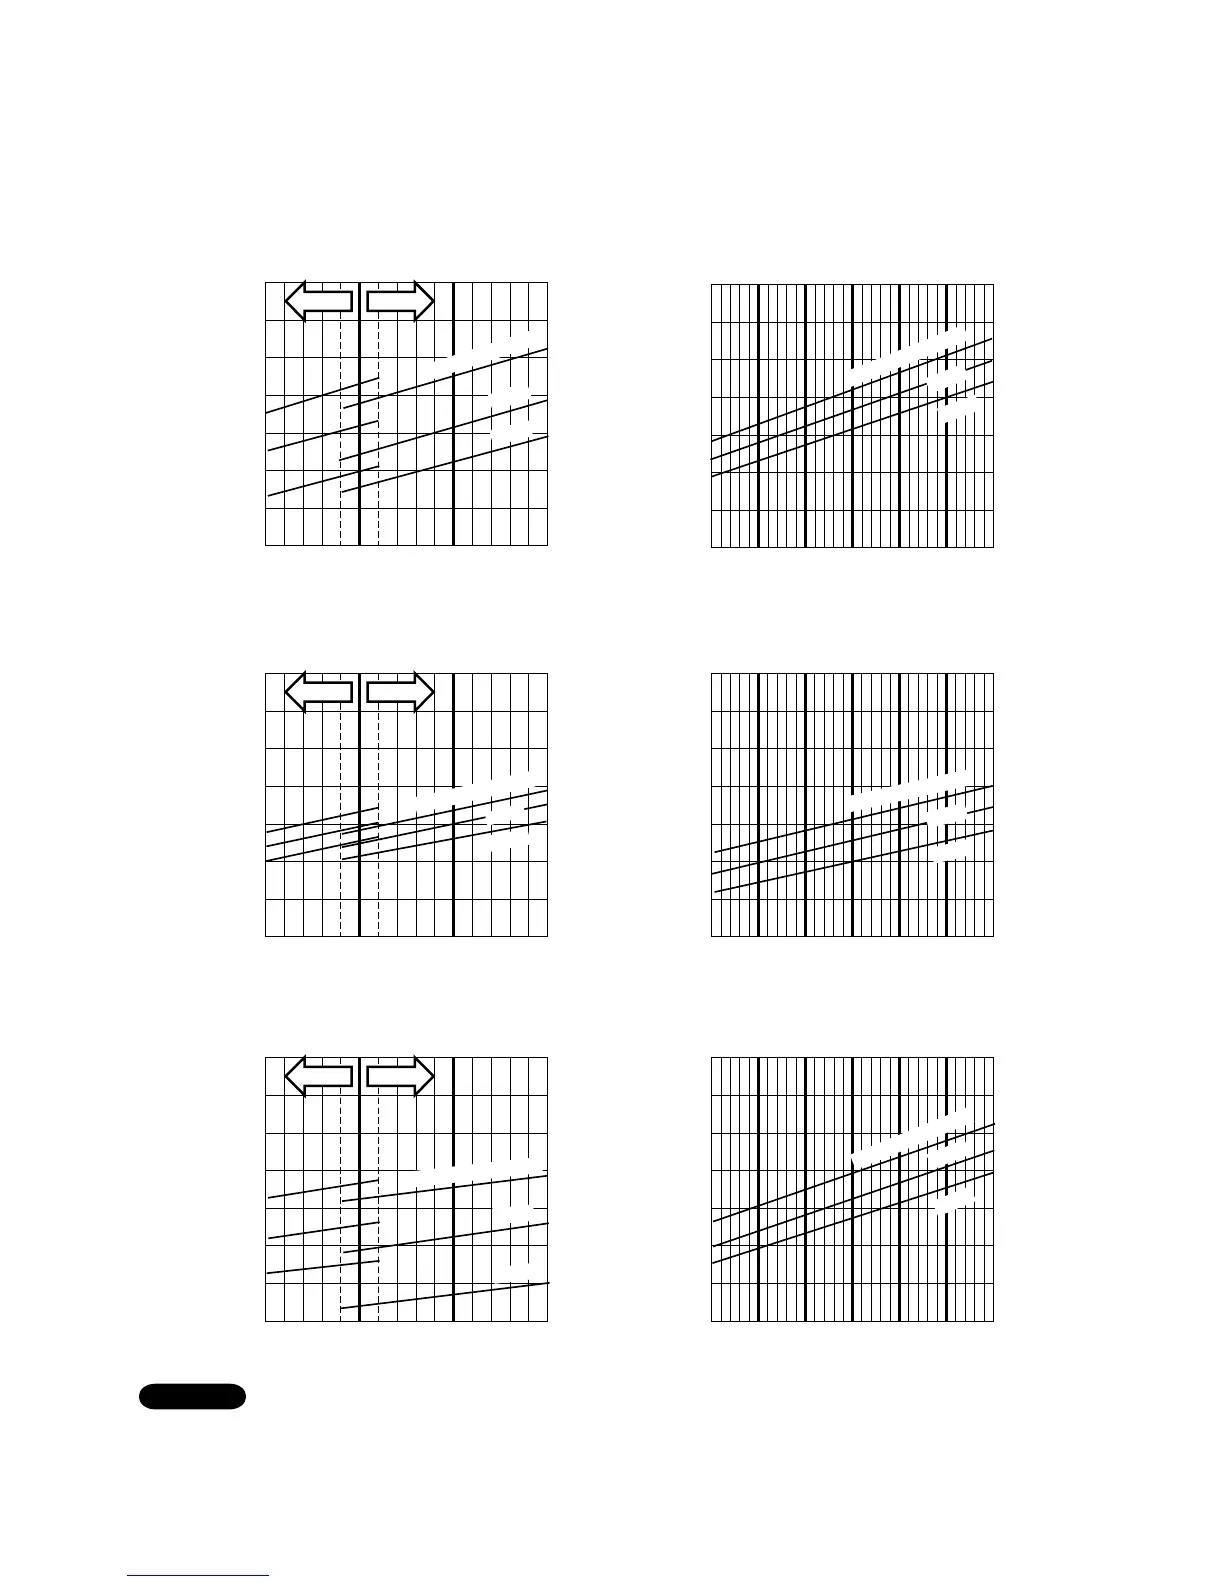
• Cooling Characteristics
• Heating Characteristics
(1) Low pressure performance chart
(RH: 46%, Indoor fan speed: High fan)
(2) Operating current performance chart
(RH: 46%, Indoor fan speed: High fan)
(50/60Hz, 220V)
(50/60Hz, 220V)
(3) Indoor discharge air performance chart
(RH: 46%, Indoor fan speed: High fan)
(3) Indoor discharge air performance chart
(RH: 85%, Indoor fan speed: High fan)
(2) Operating current performance chart
(RH: 85%, Indoor fan speed: High fan)
(50/60Hz, 220V)
(1) High pressure performance chart
(RH: 85%, Indoor fan speed: High fan)
(50/60Hz, 220V)
(50/60Hz, 220V)
(50/60Hz, 220V)
Operating current (A) Low pressure (MPa)
High pressure (MPa)Operating current (A)
Indoor discharge air temperature (°C)
Indoor discharge air temperature (°C)
Outdoor air temperature (°C) Outdoor air temperature (°C)
Outdoor air temperature (°C) Outdoor air temperature (°C)
Outdoor air temperature (°C) Outdoor air temperature (°C)
• This performance chart shows operation of a single wall-mounted indoor unit. The performance chart will vary depending on
the indoor unit type.
• Check each performance value in test-run mode. Electrical performance values represent a combined indoor/outdoor value.
(In this case, be sure to stop all the indoor units where performance is not being checked.)
• The performance is for a tubing length of 7.5 m. If the tubing length is different, the performance chart will vary.