AHT10 User Guide
11 Expansion performance
1.1 Working conditions
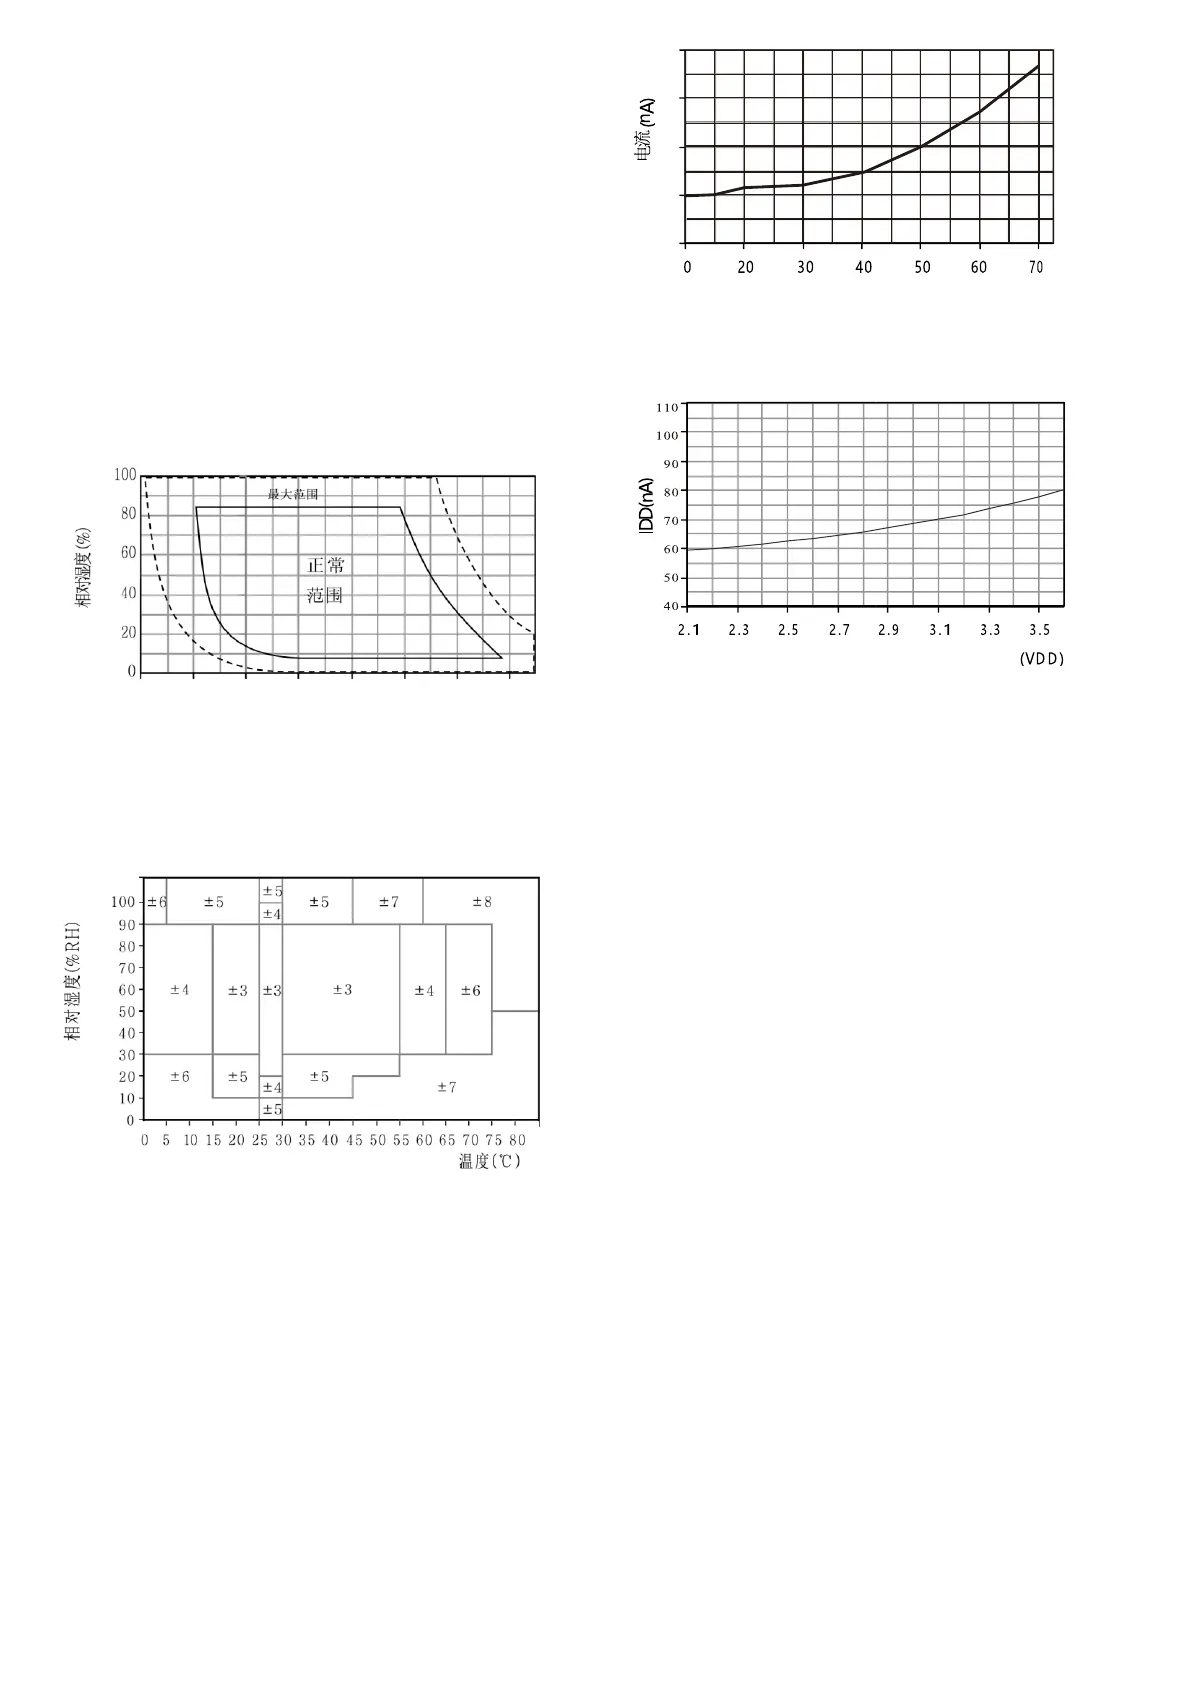
The sensor has stable performance within the
recommended operating range, see Figure 4 . Long-
term exposure to conditions outside the normal range,
especially at humidity >80 %, may result in temporary
signal drift (drift after 60hours +3% RH ). When
returning to normal operating conditions, the sensor
will slowly self-recover to the calibration state. Refer
to Section 2.3, “ Recovery Processing ” to speed up the
recovery process. Prolonged use under abnormal
conditions will accelerate the aging of the product.
-40 -20 0 20 40 60 80 100 (℃)
1.2 RH accuracy at different temperatures
The RH accuracy at 25 °C is defined in Figure 2 , and
the maximum humidity error in other temperature
segments is shown in Figure 5 .
Figure The maximum humidity error in the range of 0 0~80 °C , unit : (%RH) Please
note : The above error is the maximum error ( excluding hysteresis ) of the
reference instrument test with high precision dew point meter . The maximum
error of ± 3% RH typical range of error ± 2% RH, in other ranges, typically 1/2 of
the maximum error value.
1.3 Electrical characteristics
The power consumption given in Table 1 is
related to the temperature and supply voltage
VDD . About power estimation and see Figure 6
7 . Please pay attention to the picture 6 and The
curve in 7 is a typical natural characteristic and
there may be deviations.
Figure 6 VDD = 3.3V , typical supply current vs. temperature (sleep mode).
Please note that these data and display values are approximately ±25% deviation.
Figure 7 shows the relationship between typical supply current and supply
voltage at a temperature of 25 °C . Curve (sleep mode). Please note that
these data deviate from the displayed values. Can reach ±50% of the
displayed value . At 60 ° C , the coefficient is about 15
(Compared with Table 2 ).
 Loading...