Examine and export result
The report consists of two parts:
1. a pdf document that contains data about the result, including name, barcodes, comments,
user who started/nished the run, and graphs of temperature, setpoint and cooling rates.
2. a csv le which contains the raw temperature data logged during the run, and which is easily
imported into a spreadsheet e.g. Excel.
Please consult the manual for how to validate and digitally sign reports.
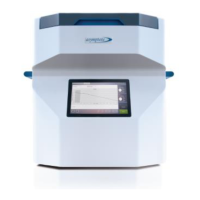
It is also possible to click any of the result items in the list. Doing so changes the menu window to the
result details menu. This menu is broadly similar to the run protocol menu and provides the same data,
but it is not possible to start a run from the result detail menu. It is however possible to add comments
to the result log, and it is also possible to examine graphs in more detail, see Figure 10.
This concludes the work ow required to run a protocol and view/export the result report.
Once a run has been completed, from the main menu press ‘Protocol Reports’ to enter
the result menu, see Figure 9. From this menu it is possible to export a result report.
Selecting a result item and pressing ‘Export’ will give you the choice of exporting a report
to USB or to an email address chosen by the user. The latter requires email functionality
to be set up, please consult the manual for this.
From the main menu, press ‘Log Out’ or ‘Shut Down’ to respectively log out of the system
or shut it down completely. If logged out, it is not possible for an unauthorized user to
make any further changes to the system. If shutting down, please wait until the screen
shows that a successful shut down has been completed and it is safe to switch off and
unplug the power cable.
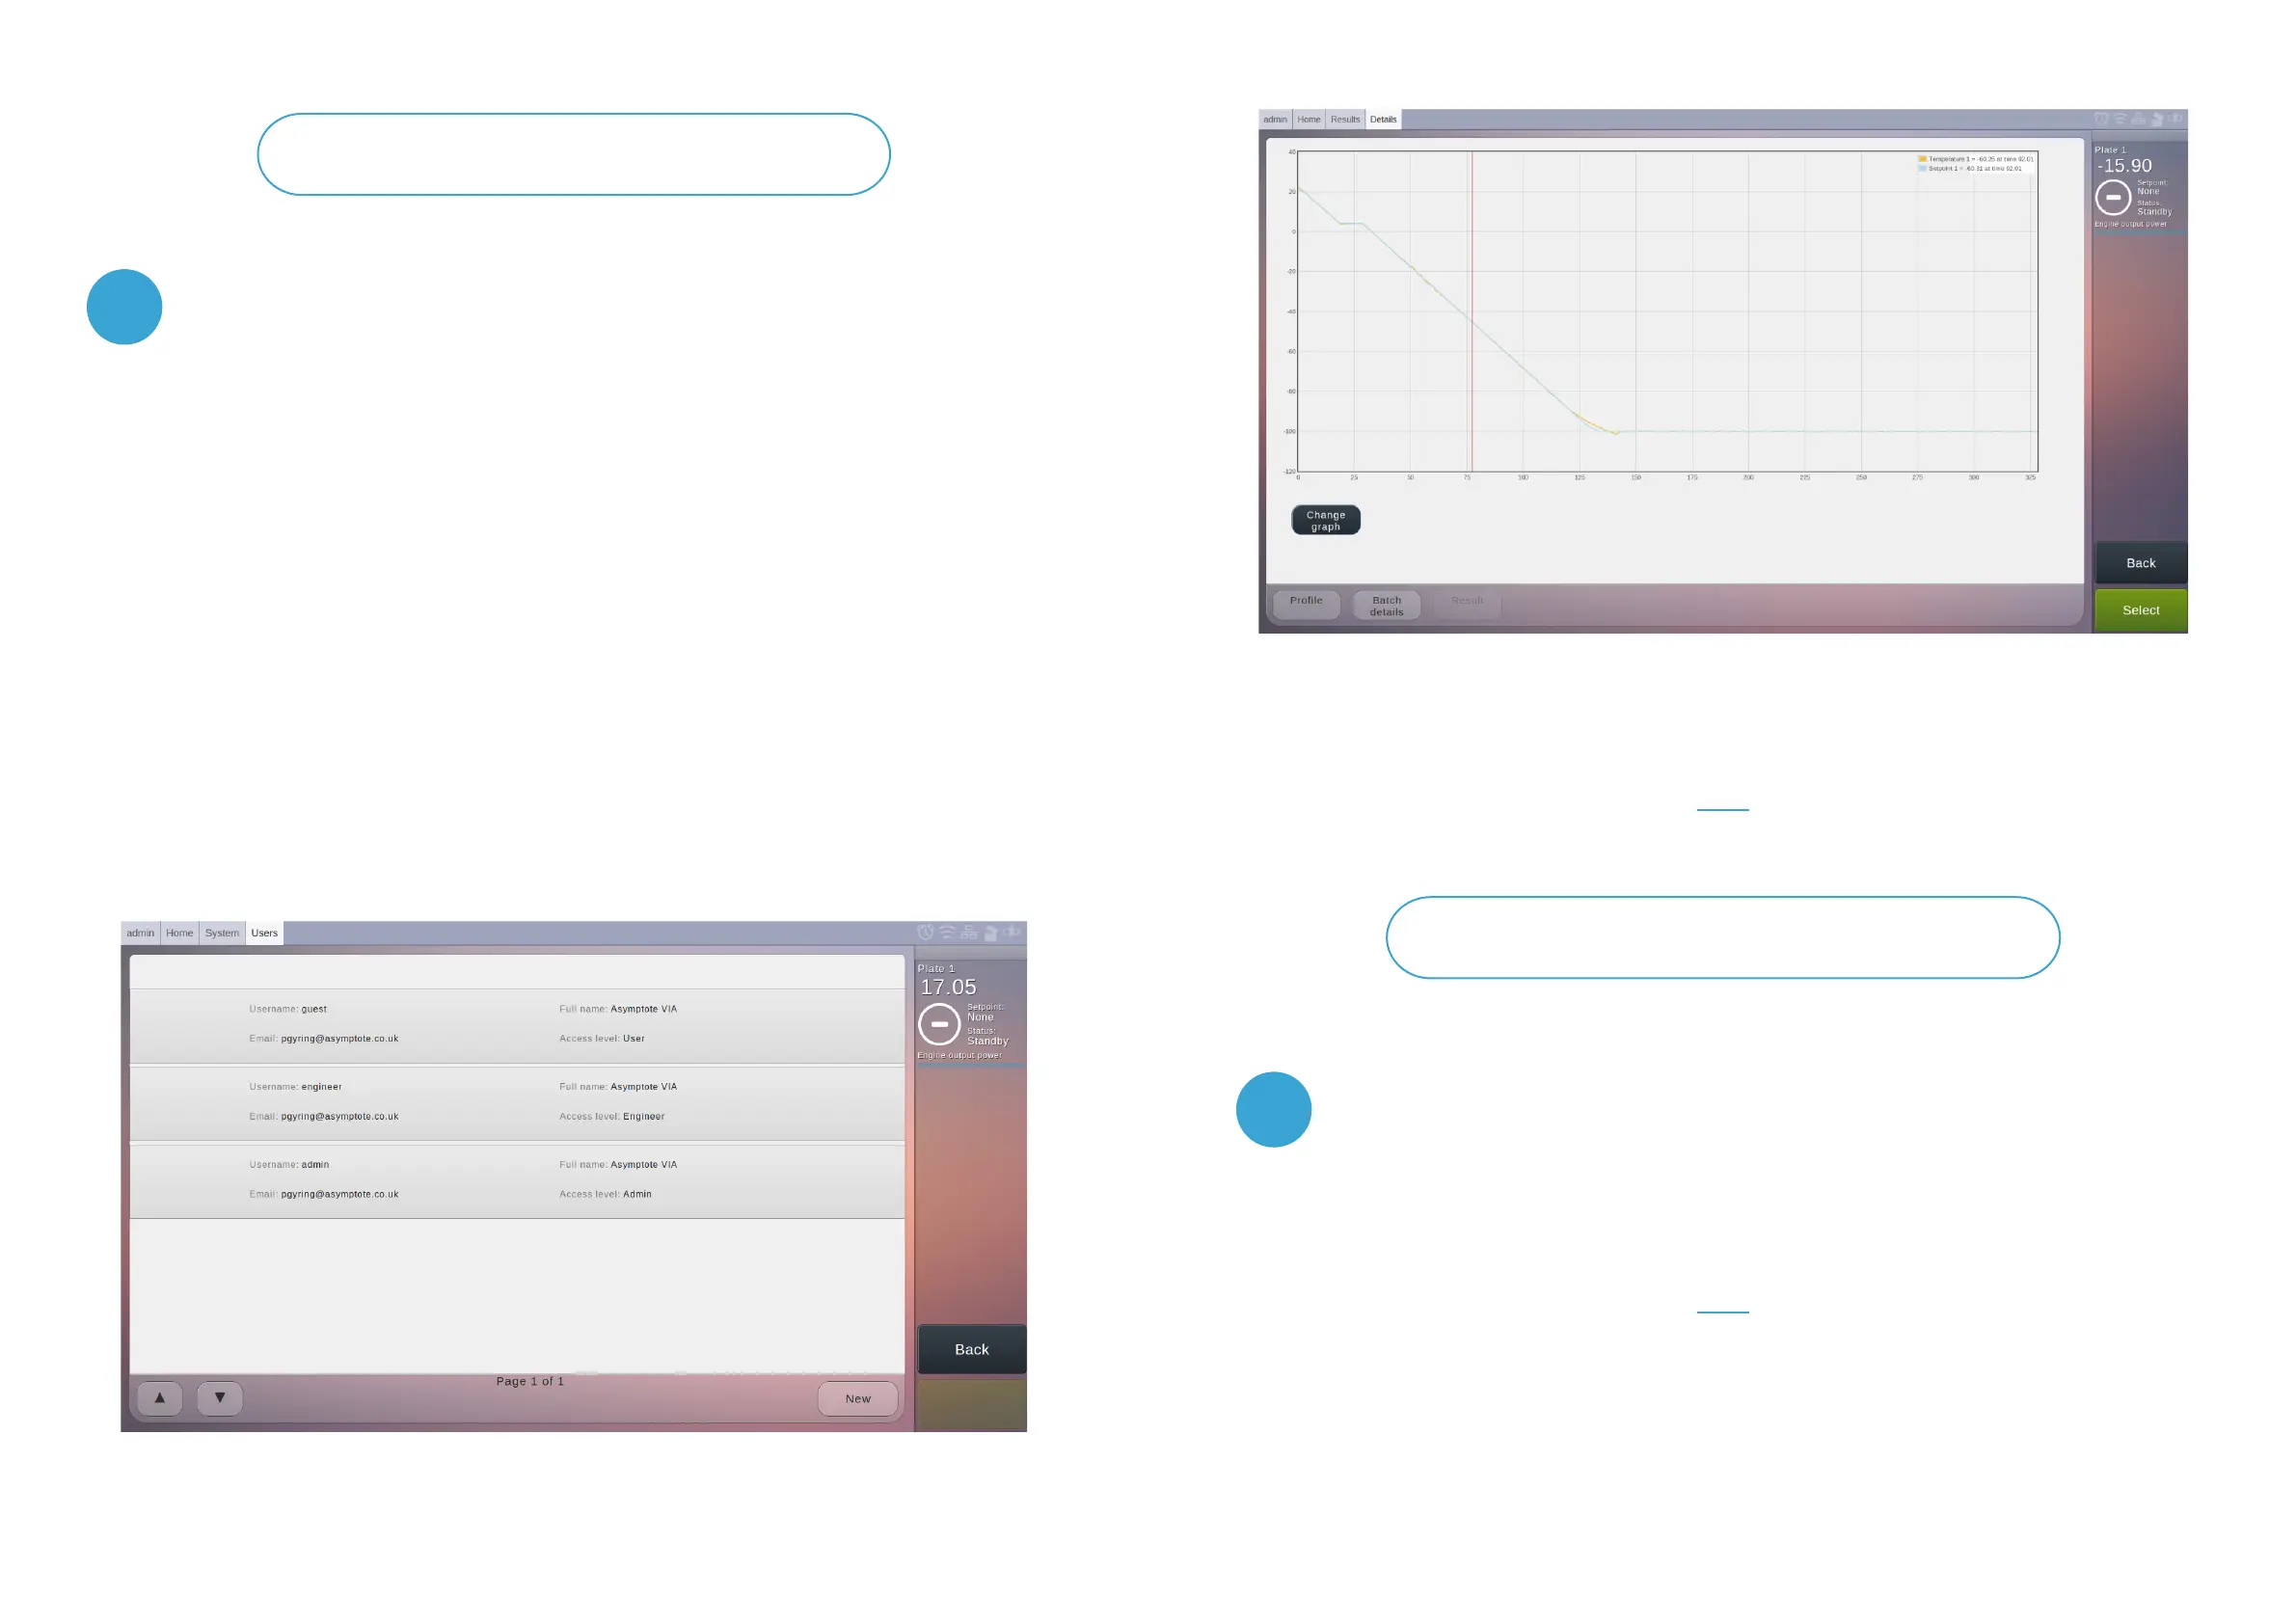
Figure 9 Result menu. This menu displays a list of completed freezing protocols, and allows
the user to ex- amine the logged data in more detail.
Figure 10 Result detail menu. The graph of logged temperatures allows the user to examine
the result in more detail.
Logging out and shutting down
9
10
16 17
 Loading...