15
Legislation
Compliance with 2010 Building
Regulations
+ASQEH@EJC/ACQH=PEKJOKQPHEJAOLA?EBE?
NAMQENAIAJPOBKNIE?NK %-1DAOANAMQENAIAJPO
are based on the heating plant emissions rate
%-"/BKNPDA=LLHE=J?AEJ=L=NPE?QH=NLNKLANPU
HPER gives an indication of carbon emissions
of the heating plant in a specific dwelling and is
CERAJEJGC ,
2
per kWh. Because the Ecogen
is heat led, the HPER is for each kWh of heat
generated, but the carbon value is for both heat
=J@AHA?PNE?CAJAN=PEKJ=OPDAAHA?PNE?EPUEO=
>ULNK@Q?P
There are different HPERs for different plant size
N=PEKO-0/1DANAMQENAIAJPOAPBKNIE?NK %-
in the 2010 Building Regulations is a maximum
%-"/KB>=OA@KJ@AB=QHPLH=JPOEVA
N=PEK
SAP & CSH
There is a section of SAP dedicated for
IE?NK %-GJKSJ=OLLAJ@ET+0-
LLAJ@ET+?NKOONABANAJ?AOLANBKNI=J?A
data from the SEDBUK database. Performance
@=P==LLA=NOEJ=@A@E?=PA@IE?NK %-OA?PEKJ
KBPDA-NK@Q?P D=N=?PANEOPE?!=P=>=OA1DA
LANBKNI=J?A@=P=EOCERAJEJPDA+KIEJ=H
Performance Data table on page 22.
The performance data is given for nominal plant
OEVAN=PEKOQLPK0-?=H?QH=PAOPDALH=JP
OEVAN=PEK>=OA@KJPDA0-DA=PHKOO?KABBE?EAJP
SAP then works out the exact performance data
between the nominal plant size ratios.
Footnote:
Based on a plant size ratio of 1.5 Primary energy factor of
BKNC=O=J@BKNAHA?PNE?EPU0"!2(ABBE?EAJP
=J@DA=PKJHU>KEHAN?=N>KJB=?PKNKBBKNC=O=J@
0.422 for electric.
maximum
appliance output
design heat loss
of the property
plant size
ratio
=
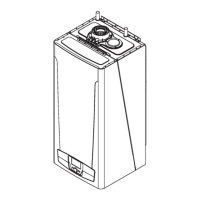
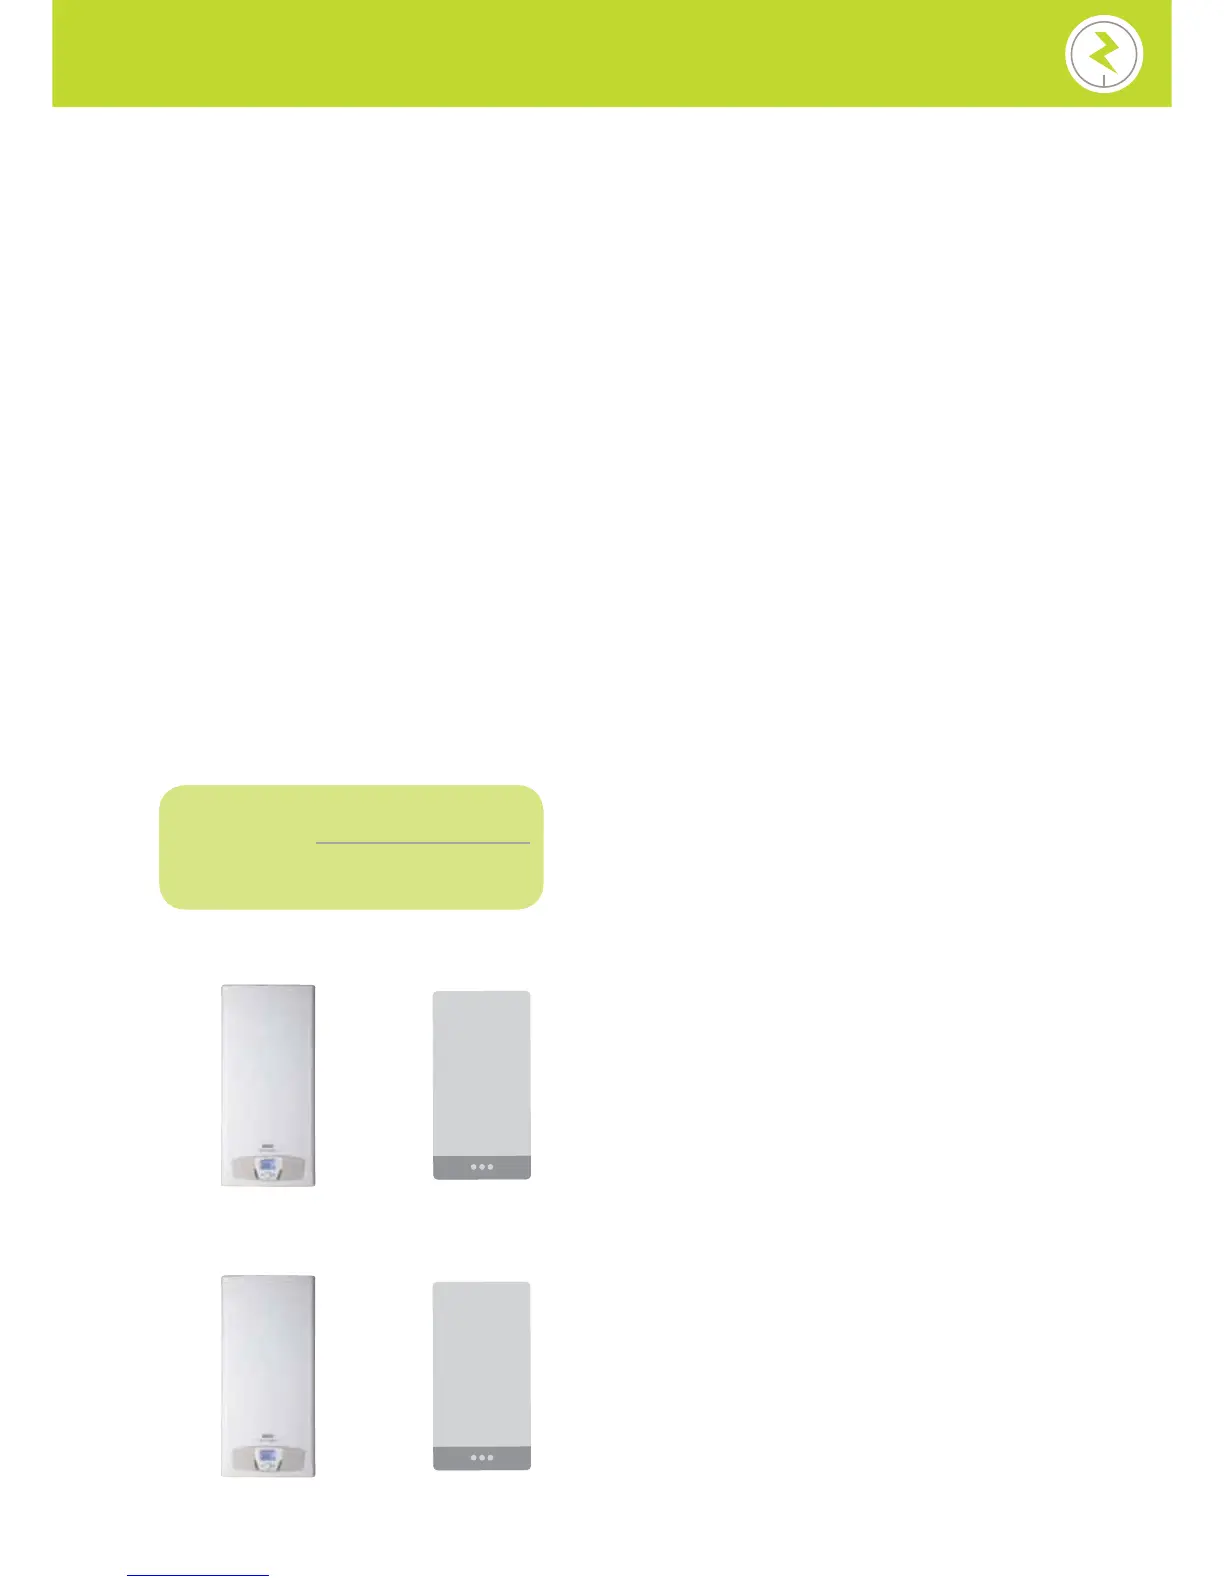
Ecogen Band A Boiler
vs
0.8 tonnes carbon saving vs Band A Boiler
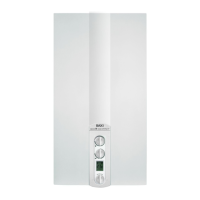
Ecogen =J@$KEHAN
vs
3.3 tonnes carbon saving vs Band G Boiler