Instruction Manual for HPA4 with 1.0.X Firmware – REV B Page 32
Performance Graphs
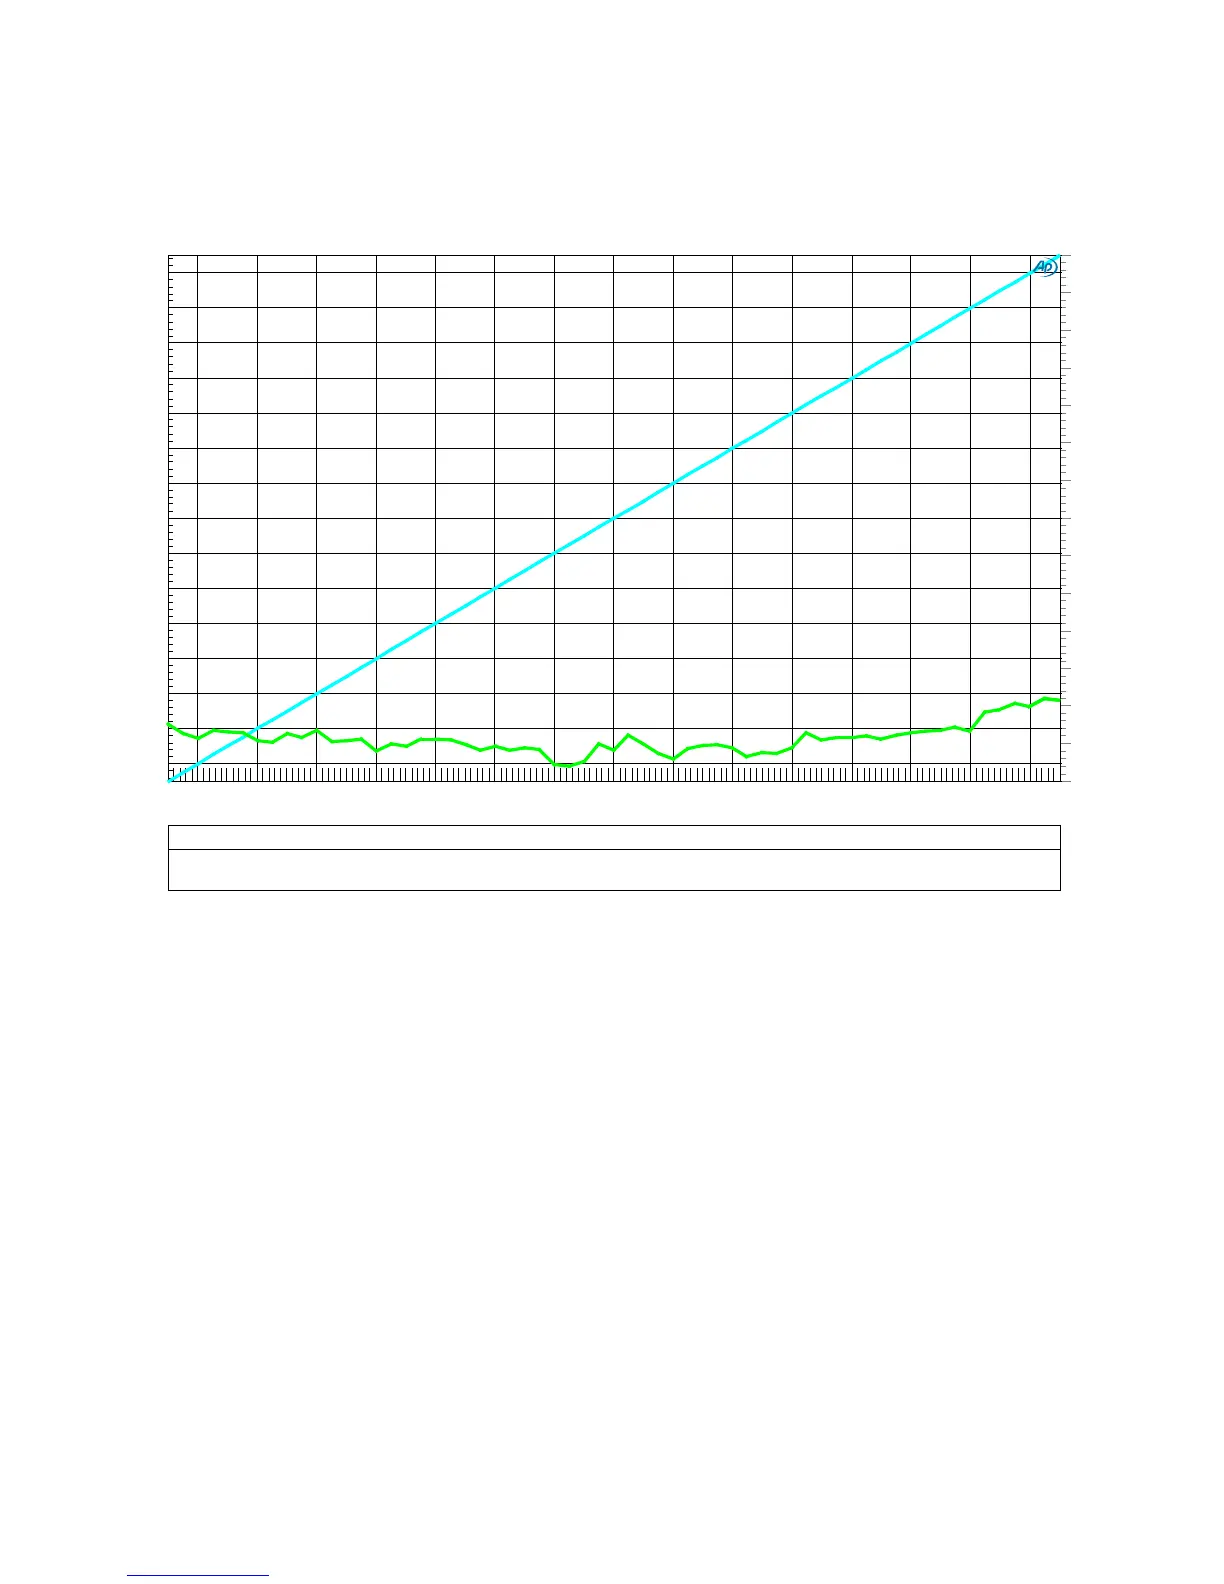
Graph 1 - Stepped Gain Control - THD vs. Gain (-15 dB to +15 dB)
The relay-controlled stepped gain controls are a key feature of the HPA4. The headphone and line
outputs have fully-independent controls. These stepped gain controls are designed to provide
volume control over a wide operating range without adding any significant noise or distortion.
This plot shows that the stepped gain control produces almost no measureable THD. Over a range
of -15 dB to +15 dB, the THD is between -120 dB (0.0001%) and -140 dB (0.00001%) and is near
the measurement limits of the AP2722 test system! This measurement includes the balanced input
and output buffers. This is a virtually distortion-free signal path with gain control.
Notes:
• The cyan curve shows the gain and uses the left-hand (dBr A) scale to show the gain in dB.
This scale is dB relative to the input level. The input level was 10 dBu throughout the test.
• The green curve shows the THD using a 1 kHz test tone. The THD is plotted in dB relative to
the output level and uses the right-hand (dB) scale. The output level was adjusted from -5
dB to +25 dBu using the stepped attenuator.
• Balanced inputs to balanced outputs.
Attenuator_THDvsGain_P15toN15.at27
ColorSweep Trace
Line Style Thick
Data Axis
Comment
1 1 Cyan Solid 4 Anlr.Level B
Left Gain dBr A
1 2
Green Solid 4
Distortion.Ch.1 Harm Sum1 Ratio Right THD dB
-140
+0
-130
-120
-110
-100
-90
-80
-70
-60
-50
-40
-30
-20
-10
-14
+14
-12
-10
-8
-6
-4
-2
+0
+2
+4
+6
+8
+10
+12
-14
+14
-12 -10
-8 -6 -4
-2
-0 +2
+4 +6
+8
+10
+12