Instruction Manual for HPA4 with 1.0.X Firmware – REV B Page 37
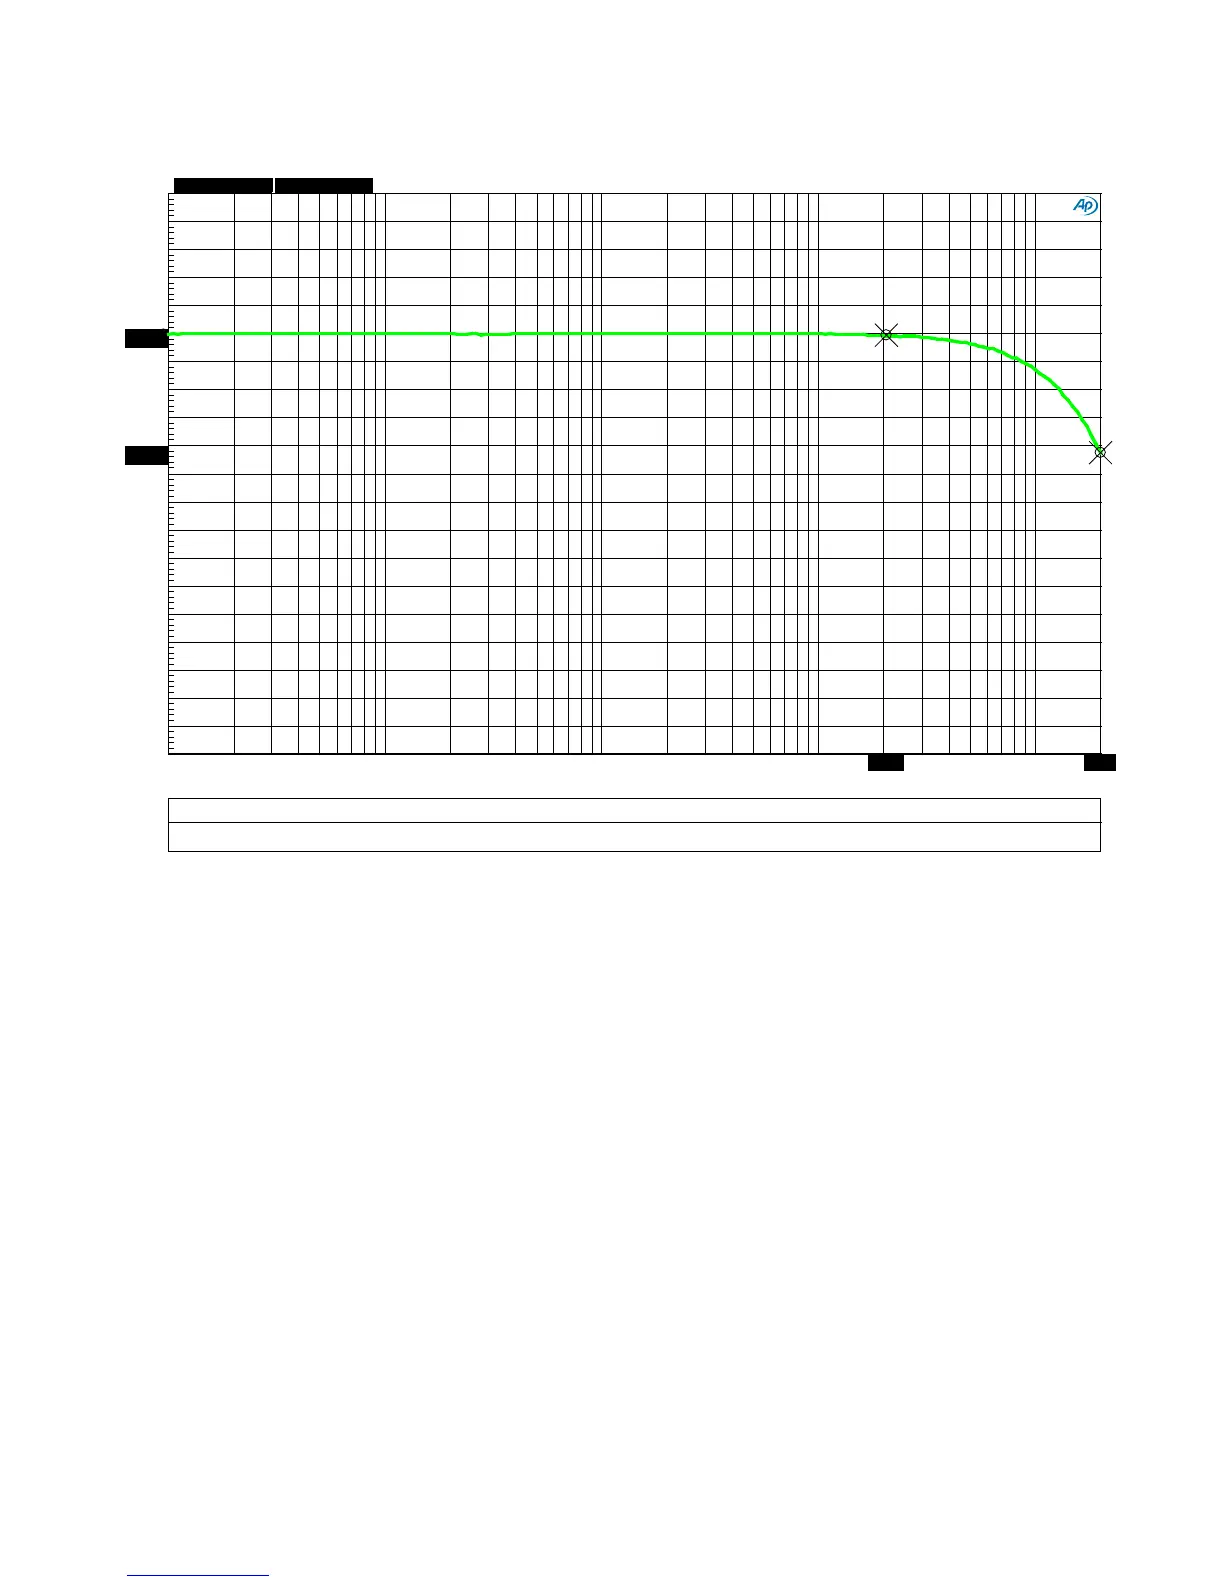
Graph 6 - Frequency Response - Headphone Amplifier - 300-Ohm Load
This plot is included to show that the frequency response of the headphone amplifier changes very
little when the load impedance changes. The 16-Ohm response (shown in Graph 7) is nearly
identical to the 300-Ohm response shown in this graph.
Notes:
• The scale on the left (dBr A) is dB relative to the output level at 1 kHz. The test used a
0-dBu test tone.
• Balanced inputs to headphone outputs, volume control set at 0 dB.
Freq_Resp_Bal_HPA_300-Ohms.at27
ColorSweep Trace
Line Style Thick Data Axis
Comment Cursor1
Cursor2
1 1
Green Solid
4 Anlr.Level A
Left HP Out into 300 Ohms
*-0.014 dBr *-0.850 dBr
-3
+1
-2.8
-2.6
-2.4
-2.2
-2
-1.8
-1.6
-1.4
-1.2
-1
-0.8
-0.6
-0.4
-0.2
+0
+0.2
+0.4
+0.6
+0.8
10
200k 20
50
100 200 500 1k 2k 5k
10k
20k 50k
100k
20.5k
200k