Instruction Manual for HPA4 with 1.0.X Firmware – REV B Page 43
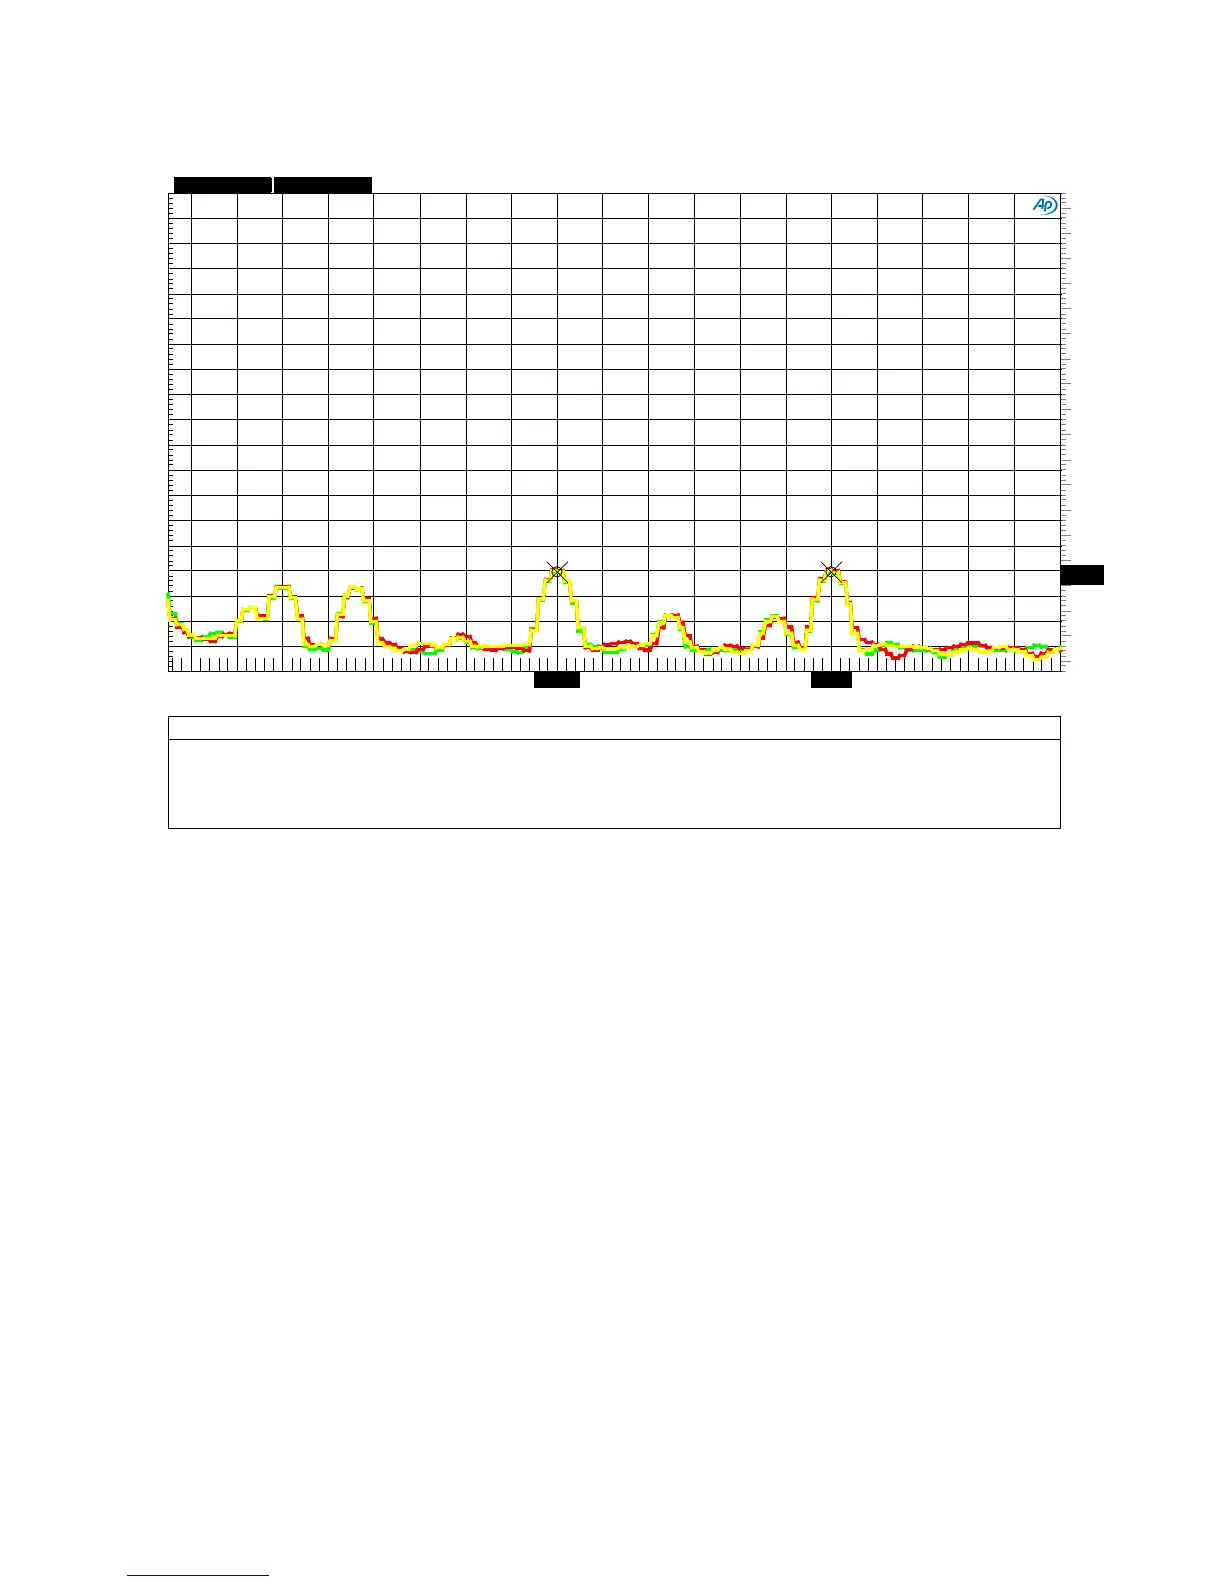
Graph 12 - AC Line-Related Hum - Line Amplifier
This FFT plot shows that AC line-related hum is 150 dB below the maximum output level of +28
dBu (use the left-hand dBr A scale)! The AC line frequency was 60 Hz in this test.
This plot also shows that AC line-related hum is 144 dB below the maximum input level of the
internal THX-888 and an externally connected AHB2 power amplifier. These levels are so low that
they will not impact the system SNR through the internal THX-888 or an external AHB2.
Notes:
• The scale on the left (dBr A) is dB relative to +28 dBu. This is the maximum input and
output level supported by the HPA4 line stage.
• The scale on the right (dBr B) is dB relative to +22 dBu. This is the input level required to
drive an external AHB2 power amplifier to full output power. It is also the level required to
drive the internal THX-888 to full output power.
• Balanced inputs to balanced line outputs, volume control set at 0 dB.
FFT_Idle_Unity_Gain_Bal_Bal_Low_Freq.at27
ColorSweep
Trace Line Style
Thick Data Axis
Comment Source 2
Cursor1 Cursor2
1 2
Green Solid
4 Fft.Ch.1 Ampl Left
Left Line Out : 1.00000 =Swr.Ch. A Input
-150.645 dBr A -150.464 dBr A
1
3
Green Solid 4 Fft.Ch.1 Ampl Right
: 1.00000 =Swr.Ch. A Input *-144.645 dBr
*-144.464 dBr
2 2 Red Solid 4
Fft.Ch.1 Ampl Left Right Line Out : 2.00000 =Swr.Ch. A Input -149.889 dBr A
-149.685 dBr A
2
3
Red Solid
4
Fft.Ch.1 Ampl Right
: 2.00000 =Swr.Ch. A Input -143.889 dBr B -143.685 dBr B
3
2 Yellow Solid
4 Fft.Ch.1 Ampl
Left Mono Line Out
: 3.00000 =Swr.Ch. A Input -150.113 dBr A -150.050 dBr A
3 3 Yellow
Solid 4 Fft.Ch.1 Ampl Right
: 3.00000 =Swr.Ch. A Input -144.113 dBr B
-144.050 dBr B
-180
+0
-170
-160
-150
-140
-130
-120
-110
-100
-90
-80
-70
-60
-50
-40
-30
-20
-10
-190
+0
-180
-170
-160
-150
-140
-130
-120
-110
-100
-90
-80
-70
-60
-50
-40
-30
-20
-10
20 400 40 60 80 100 120 140 160 180 200 220
240
260
280
300 320 340 360 380
180.196 300.02