Instruction Manual for HPA4 with 1.0.X Firmware – REV B Page 48
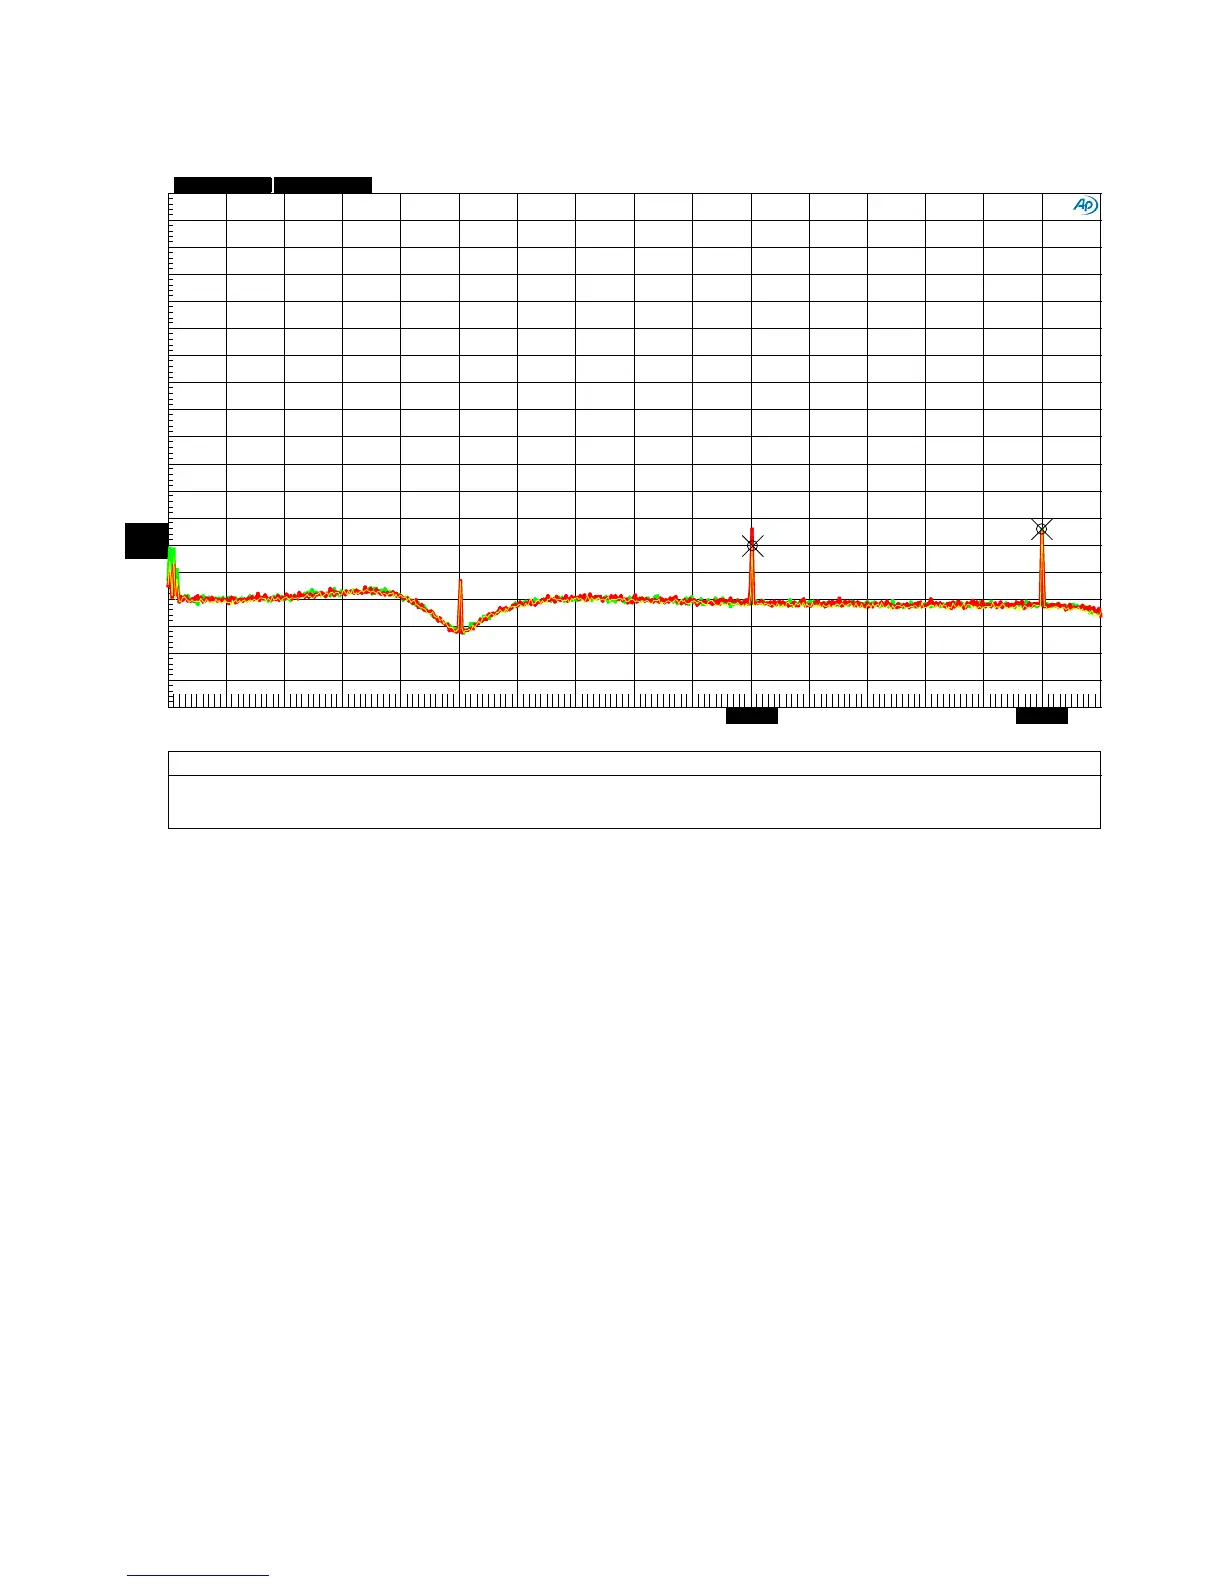
Graph 17 - FFT 10 kHz Tone at 22 dBu - Line Amplifier
This plot shows that the THD produced by the line amplifier is extremely low, even when delivering
a very high 22 dBu output. The 2nd and 3rd harmonics each measure better than -124 dB
(0.00006%)! This test shows that THD does not increase when reproducing high frequencies.
Notes:
• The scale on the left (dBr B) is dB relative to +22 dBu. This is the signal level required to
drive an external AHB2 power amplifier to full output power. It is also the level required to
drive the internal THX-888 to full output power. It is also the level of the test tone.
• Balanced inputs to balanced line outputs, volume control set at 0 dB.
• The 10 kHz fundamental has been removed using a notch filter. This filter increases the
resolution of the AP2722 test system.
ColorSweep
Trace Line Style Thick Data Axis
Comment
Source 2 Cursor1
Cursor2
1
2
Green
Solid 4
Fft.Ch.1 Ampl Left Left Line Out
: 1.00000 =Swr.Ch. A Input *-130.406 dBr
*-124.343 dBr
2 2
Red Solid 4
Fft.Ch.1 Ampl Left Right Line Out
: 2.00000 =Swr.Ch. A Input -124.132 dBr B
-125.049 dBr B
3
2 Yellow Solid 1
Fft.Ch.1 Ampl Left Mono Line Out
: 3.00000 =Swr.Ch. A Input -130.115 dBr B -124.568 dBr B
-190
+0
-180
-170
-160
-150
-140
-130
-120
-110
-100
-90
-80
-70
-60
-50
-40
-30
-20
-10
2k 32k
4k 6k 8k 10k
12k 14k
16k
18k 20k
22k
24k 26k
28k 30k
20.0429k 29.9967k