11
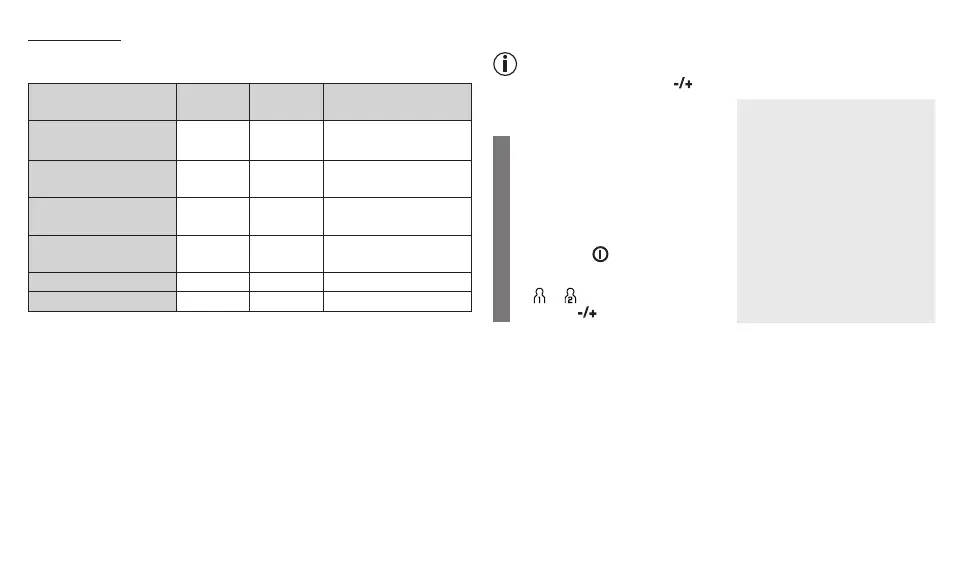
Risk indicator:
The measurements can be classified and evaluated in accordance with
the following table.
Blood pressure value
category
Systole
(in mmHg)
Diastole
(in mmHg)
Action
Setting 3: severe
hypertension
≥ 180 ≥ 110 seek medical attention
Setting 2: moderate
hypertension
160 – 179 100 – 109 seek medical attention
Setting 1: mild hyper-
tension
140 – 159 90 – 99
regular monitoring by
doctor
High normal 130 – 139 85 – 89
regular monitoring by
doctor
Normal 120 – 129 80 – 84 self-monitoring
Optimal < 120 < 80 self-monitoring
Source: WHO, 1999 (World Health Organization)
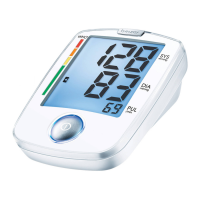
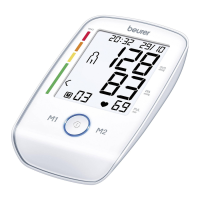
The bar chart on the display and the scale on the unit show which cat-
egory the recorded blood pressure values fall into.
If the values of systole and diastole fall into two different categories (e.g.
systole in the High normal category and diastole in the Normal category),
the graphical classification on the device always shows the higher cat-
egory; for the example given this would be High normal.
7. Saving, displaying and deleting measurements
Whilst the message is being displayed, the volume can be adjusted
with the function buttons .
Voice output when voice function
is active
User memory
The results of every successful
measurement are stored together
with the date and time. If there are
more than 60 measurements, the
oldest measurements are lost.
•
Switch on the device with the
Start/stop button.
The device is ready for use.
You may start measuring.
•
Select the desired user memory
( or ) by pressing the function
buttons .
User memory 1
User memory 2