SH042-1 User Manual for BodiTrak LT V1.5, 25 Jan 2019
8
BodiTrak Technical Support: 800-847-3157
On the left hand side of the display you will observe:
• a color bar indicating the level of pressure from 5-200 mmHg, or a chosen
pressure range
• the center of pressure on the mat, represented by a white dot
• the Dispersion Index box: a rectangle defined as 8 sensors across and 6 sensors
down which you can drag to a desired location (for example the ischial-sacrum
area) to calculate the Dispersion Index
• statistics which are useful for considering solutions and are explained as follows:
Dispersion Index (%) –The sum of pressure distributed over a region (for example
the ischial tuberosity (IT) and the sacral-coccygeal region) divided by the sum of
pressure readings over the entire sensor mat, expressed as a percentage. A value
of 50% or more is indicative of a potential risk of skin trauma.
Peak Pressure Index – The average of the highest recorded pressure values
within a 9 to10cm
2
area (the contact area of an IT). PPI is a better comparative
bench mark than average seat pressures.
Sensing Area (in
2
) – The area of the mat the client is resting on which is displaying
above the minimum setting, e.g. 5 mmHg. Generally you want a larger sensing or
contact area as this means the area of support has increased.
C of V (%) – The coefficient of variation shows how evenly the pressure is
distributed across a support surface. It is expressed as a percentage, and is
normally the inverse of the sensing area. It is better to have a lower CoV value, but
be careful to compare to the pressure map; you may have a low CoV but still have a
high localized force somewhere in the seat surface.
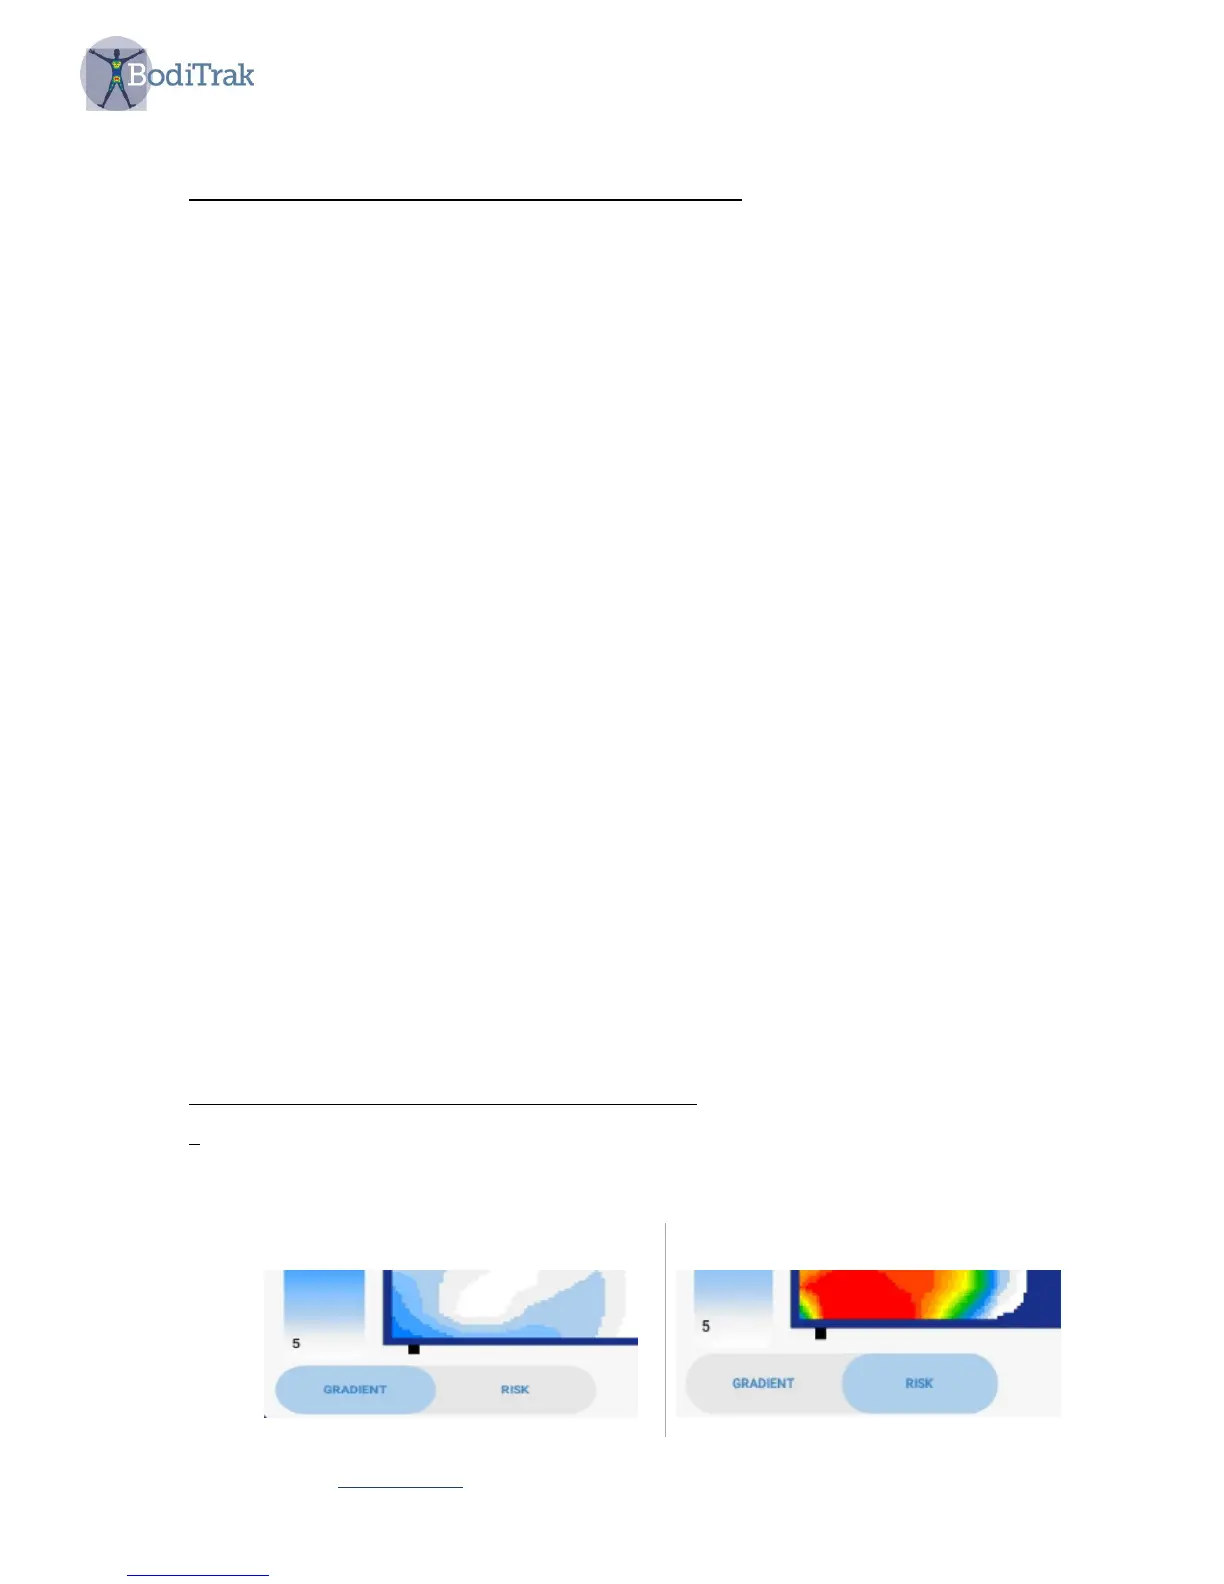
On the right side of the display you will observe:
• Gradient and Risk display choices, as shown here in Figure 2
GRADIENT (spatial pressure)
RISK (pressure vs. time)
 Loading...