STATISTICS
Comparing data sets with box and whisker plots
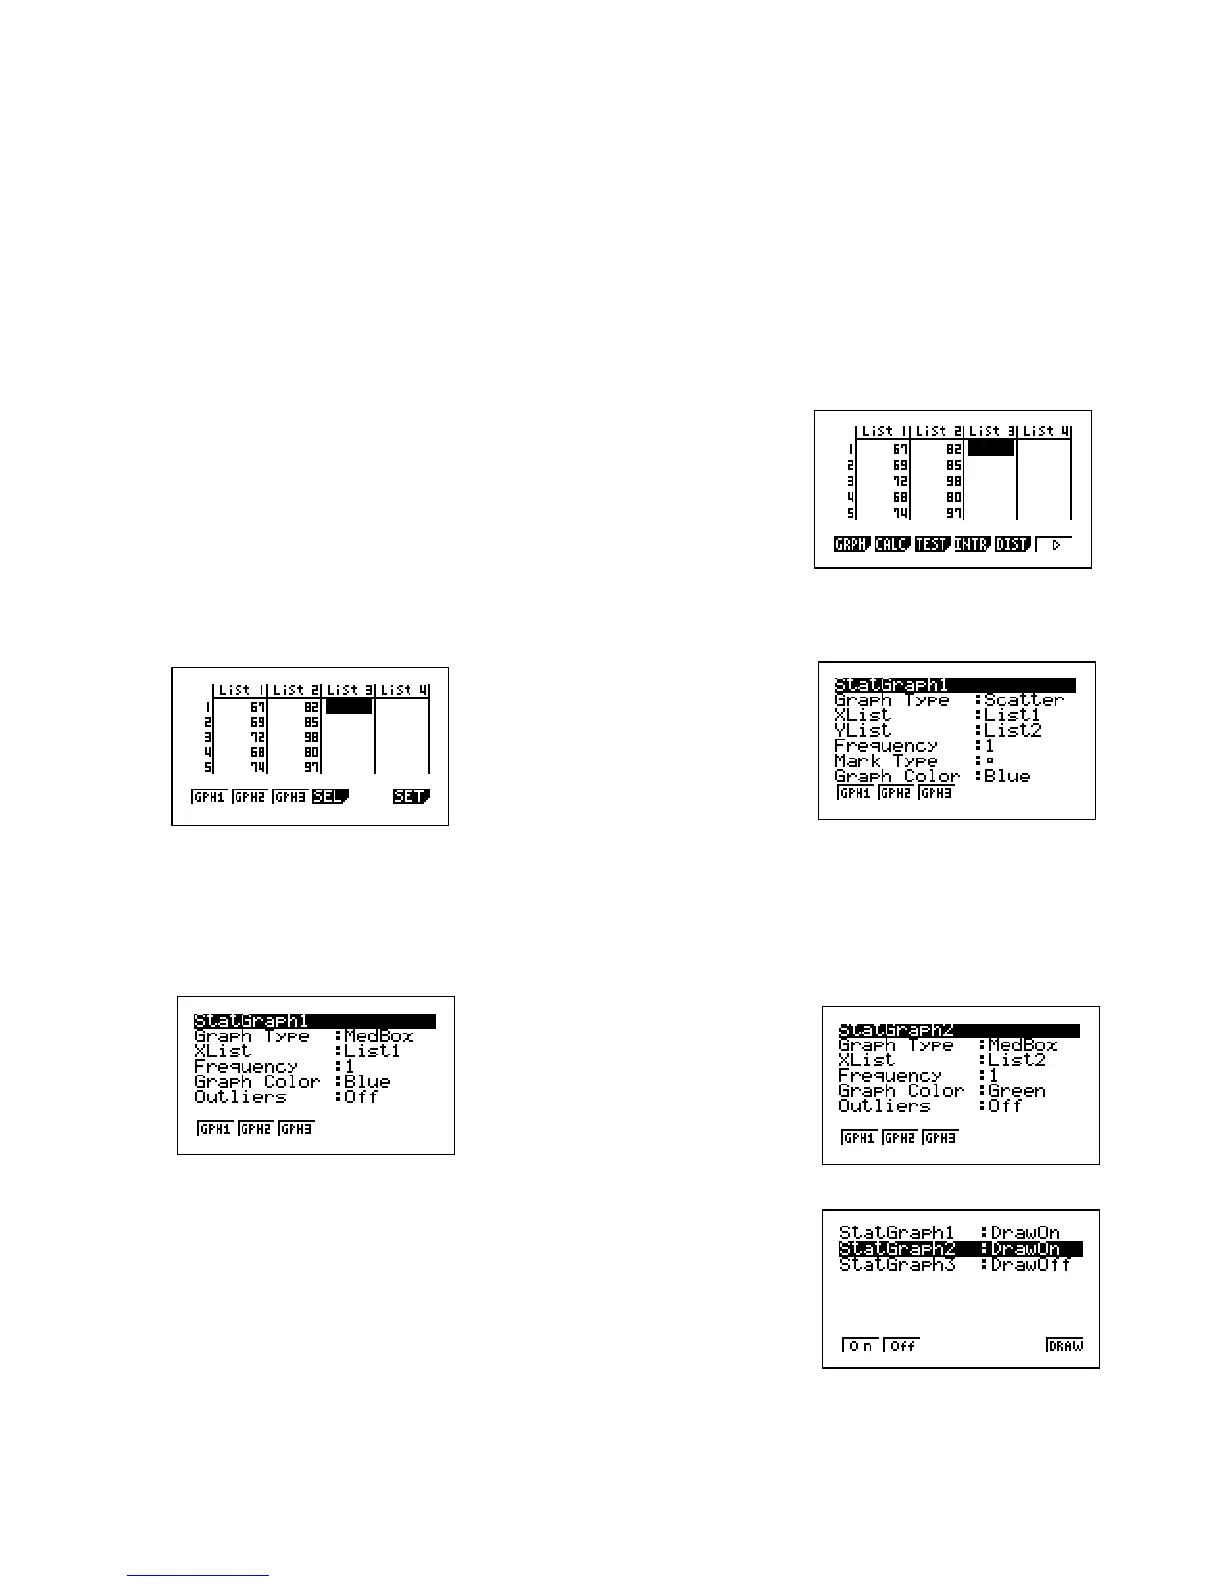
Resting Heart Rate – RHR
Active Heart Rate – ACR
RHR 67, 69, 72, 68, 74
ACR 82, 85, 98, 80, 97
Enter into the STAT mode, then enter the resting and active
heart rates into List1 and List 2 respectively.
Select the GRPH (F1) command followed by SET (F6) to determine the type of graph
that you want to select.
To set StatGraph1 scroll down to Graph Type, press the continuation key (F6),
followed by F2 to select a Median Box Plot. Scroll back to the top of the screen and
press StatGraph2 (F2), then select another Median Box Plot. Importantly, continue to
scroll down the screen to XList and select List2 (F2) and change the colour of
StatGraph2 if you desire.
Now, press the EXIT key followed by SEL (F4) to select both
graphs drawn at the same time.
(StatGraph1 will be On, scroll down to StatGraph2 and turn
On using F1).
 Loading...


