6-17
• Linear Regression (ax + b).............
(
a + bx).............
• Quadratic Regression.....................
• Cubic Regression...........................
• Quartic Regression ........................
• Logarithmic Regression..................
• Exponential Repression (
a·e
bx
).......
(
a·b
x
)........
• Power Regression ..........................
• Sin Regression...............................
• Logistic Regression........................
S Estimated Value Calculation for Regression Graphs
The STAT mode also includes a Y-CAL function that uses regression to calculate the estimated
y-value for a particular x-value after graphing a paired-variable statistical
regression.
The following is the general procedure for using the Y-CAL function.
1. After drawing a regression graph, press (G-SLV)(Y-CAL) to enter the graph
selection mode, and then press U.
If there are multiple graphs on the display, use D and A to select the graph you want,
and then press U.
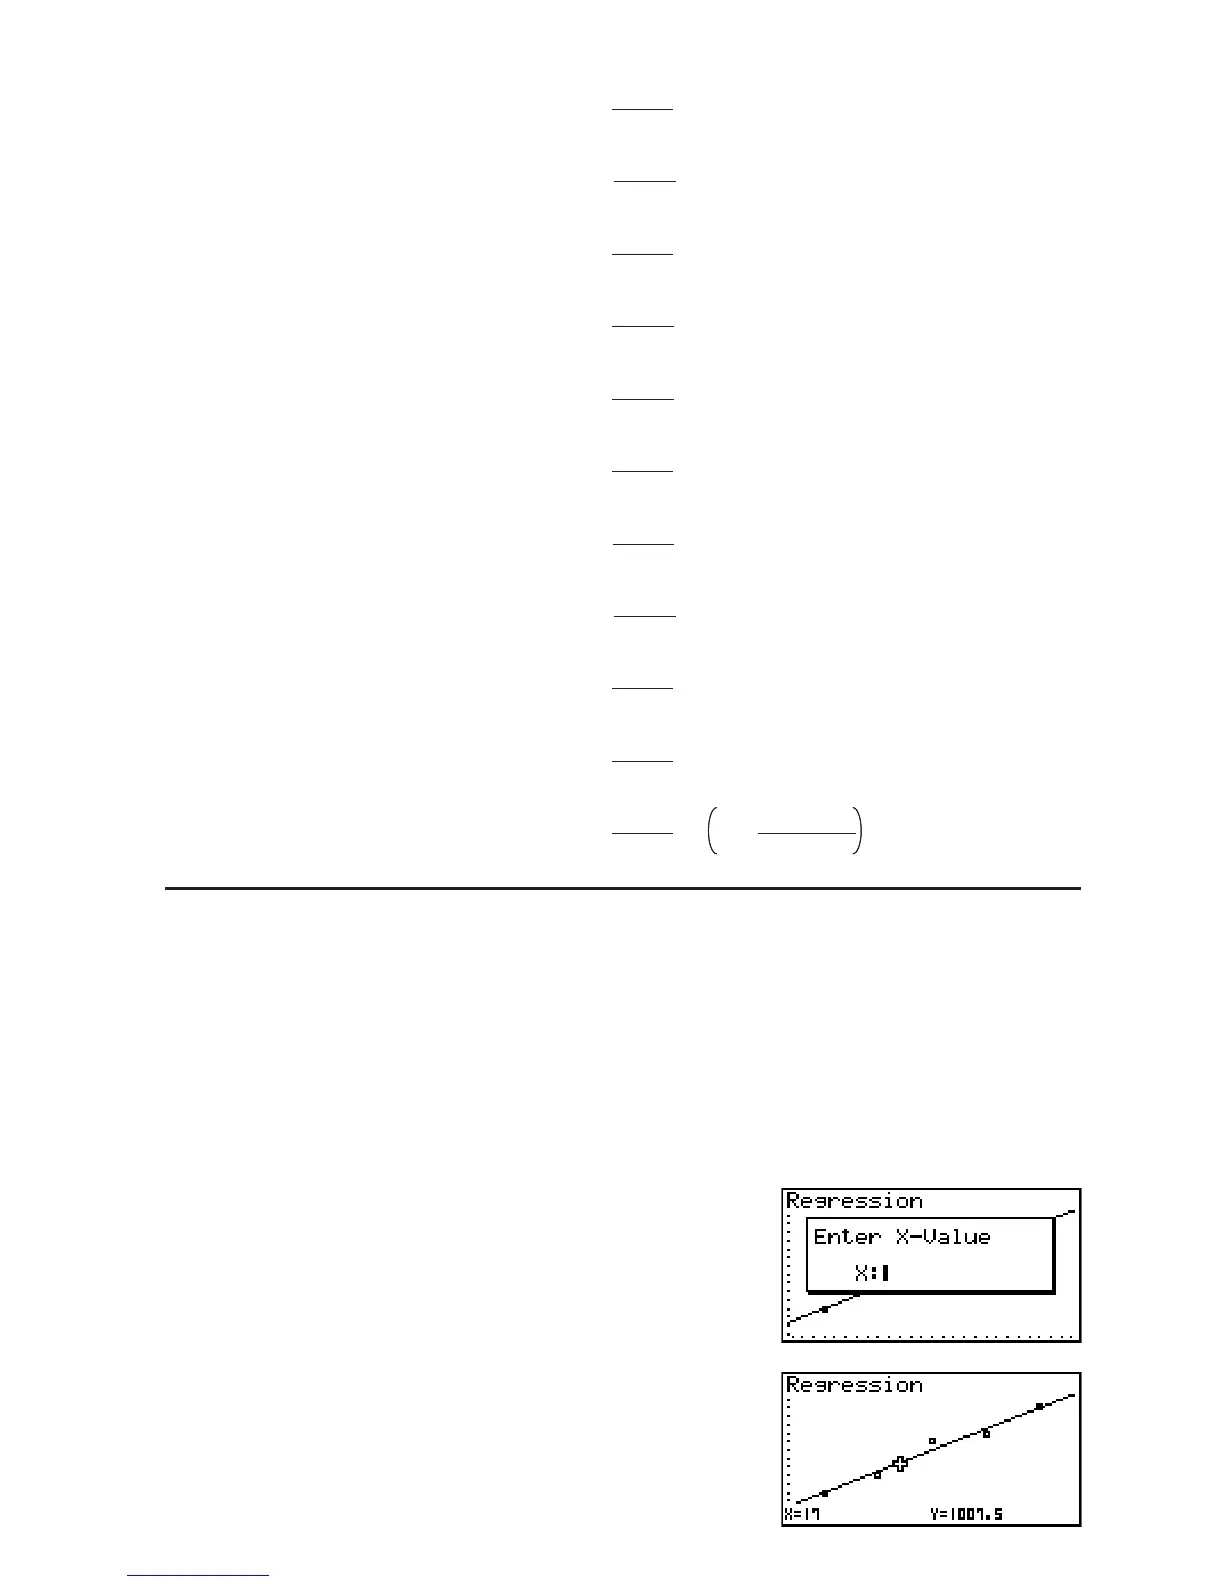
• This causes an
x-value input dialog box to appear.
2. Input the value you want for
x and then press U.
• This causes the coordinates for
x and y to appear at
the bottom of the display, and moves the pointer to the
corresponding point on the graph.