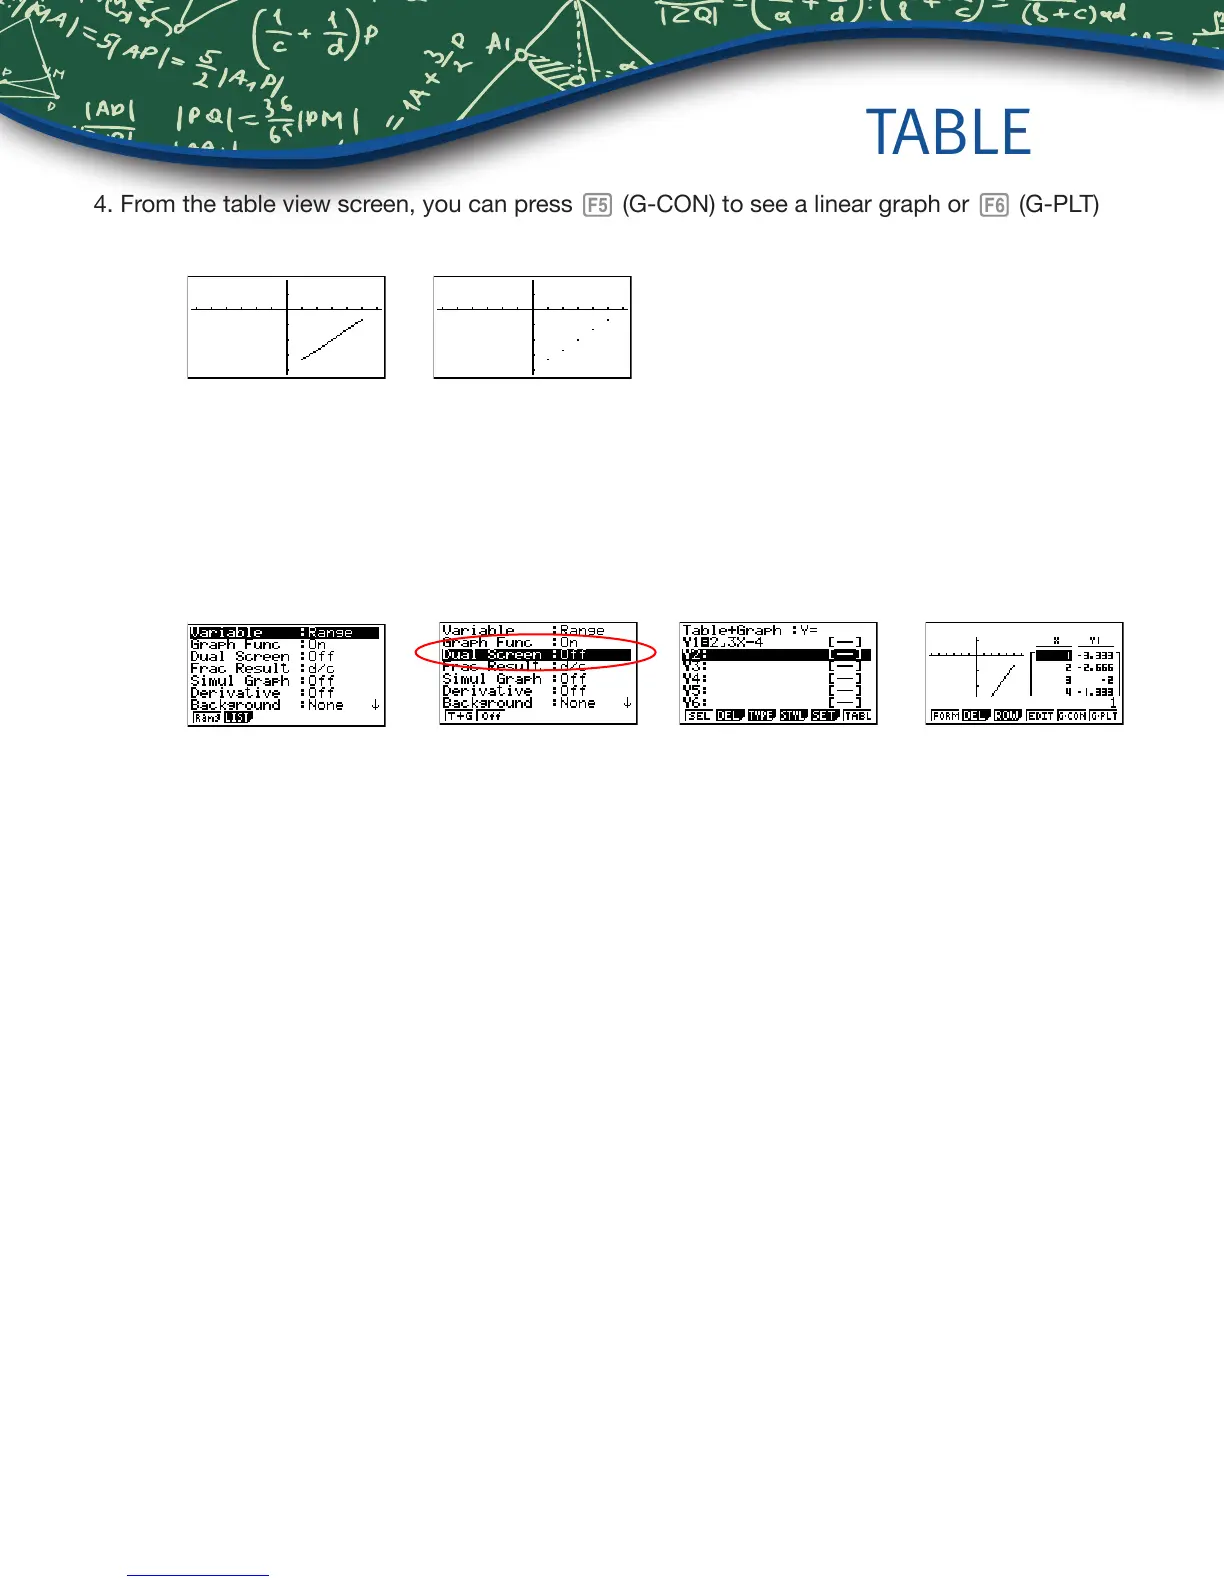
4. From the table view screen, you can press y (G-CON) to see a linear graph or u (G-PLT)
to see a plot graph for the function you entered.
5. To see a split screen of your table and graph, press Lp to enter the SET UP menu for the
TABLE icon. Scroll down to Dual Screen, select q (T + G), d, then u (TABL).
If you manually entered values to the previous table that you still want displayed, you can re-enter
them here, then press l to see the graph of that table.
TABLE
Getting Started with the fx-9750GII
8

 Loading...


